In the last few days whilst scanning Amazon’s Seller Central we have noticed a minute change to the metrics available on business reports which has the potential to make a huge difference to your advertising and listing strategies.
Conversion Rate (CVR) Update
Whilst conversion rate (fancily known as ‘Unit Session Percentage’ on Amazon’s Business Reports) is obviously not new to any Amazon Seller, many may not have noticed that the calculation for this has actually changed significantly.
To find your Unit Session Percentage fro each child ASIN you have, open Seller Central and go to:
Reports > Business Reports > Detail Page Sales and Traffic By Child Item (down the left hand side of the screen).
This should bring you to a page that looks like the screen below:
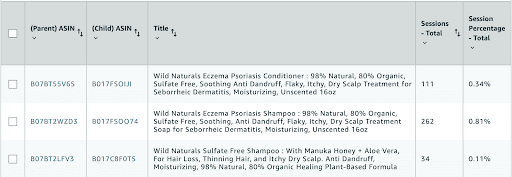
You can scroll horizontally on this table until you see ‘Unit Session Percentage’.
Prior to the update, conversion rate was a measure of how many units of a product were ordered in relation to the total sessions on that product. However, the total sessions was a count of how many people had viewed the product on a desktop device only. This wrongly left out the sessions that occured on mobile devices.
Hence, the old equation for this can be found below:
CVR = total sales / total sessions (desktop only)
Eg for 150 sales which was achieved after 300 desktop views, the CVR appeared to be:
(150/ 300) x 100 = 50%
Amazon has since rectified the ‘Total Sessions’ figure so that it rightfully includes the large number of customers who view products on their mobile devices. In turn, the total sessions for any product is likely to be higher, providing at least one person has gone onto their product detail page on their mobile.
Therefore, the new equation is:
CVR = total sales / total sessions (desktop and mobile sessions)
Eg for 150 sales which was achieved after 300 desktop views and 300 mobile views, the CVR is in fact:
(150/600) x 100 = 25%
What does this mean?
As can be seen from the stats, whilst the same amount of sales has been achieved in both scenarios, the inclusion of mobile sessions has slashed the conversion rate on this product by half.
This is likely to be the case for almost all of your products so long as the product is discoverable via mobile phone, as it would mean that there are actually more sessions than you may have realized.
Due to this information, it is important to not be disheartened if you have noticed your CVR has significantly depleted. This is particularly true for those that have a large percentage of their audience viewing their products on mobile.
We have found from our experience that products which are cheap and may be seen as an insignificant purchase to the user, are likely to be heavily mobile-centric products. On the other hand, users tend to hop onto a desktop device to surf for more expensive products which may need more consideration before being purchased.
Therefore, if your product is on the lower end of the price scale, you may see the impacts of this metric change in larger effect.
Mobile and desktop metrics introduced
On top of the more accurate CVR being introduced, Amazon has also added a feature that can be very helpful for sellers. Unlike before, sellers are now able to see how many people are viewing each of their products on a mobile vs on a desktop.
Whilst this may not seem as an important feature, it can be much more beneficial than you imagine, as I will get onto earlier.
So how can you access these new figures? First, follow the same process as earlier to get to the ‘Detail Page Sales and Traffic By Child Item’ section of business reports. Once here, you can select the ‘SHOW/HIDE COLUMNS’ button which is hidden on the right hand side of the screen next to the table, as can be seen below:
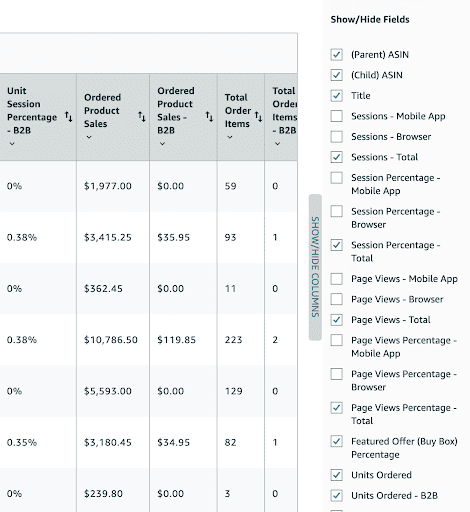
You should also see the same boxes ticked on your side as are ticked here, if you have never noticed the ability to toggle between the metrics before.
Interestingly, the added metrics to do with mobile and desktop specific figures aren’t automatically selected so you will have to go into this bar and select each of the new metrics. Once this is done you should be able to see the column of each has been added to the table.
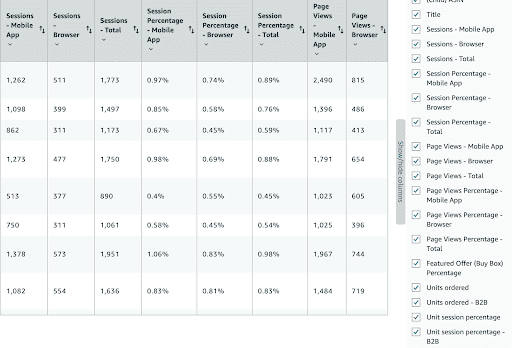
You should then be able to see this:
What do these metrics mean?
‘Sessions – Mobile App’ and ‘Sessions – Browser’ are new additions to the list. The mobile metric is a measure of visits to your Amazon.com mobile app pages by a user, all activity within a 24-hour period is considered a session. This is the same for the browser metric however this is how many visits to your Amazon.com desktop pages there are.
‘Session Percentage’ on the other hand is a measure of the percentage of mobile app/desktop sessions that contain at least one page view for a particular SKU/ASIN relative to the total number of sessions for all products. Hence, it displays out of all of your products which ones have the highest proportion of views on that device.
How can you use this information?
The experience you get when shopping for a product on your phone and on your laptop are entirely different. You need only to go onto Amazon on the different devices in order to see the several differentiating features.
The major difference between the two is the order of content you will see when scrolling through the page. This can be detailed in the table below:
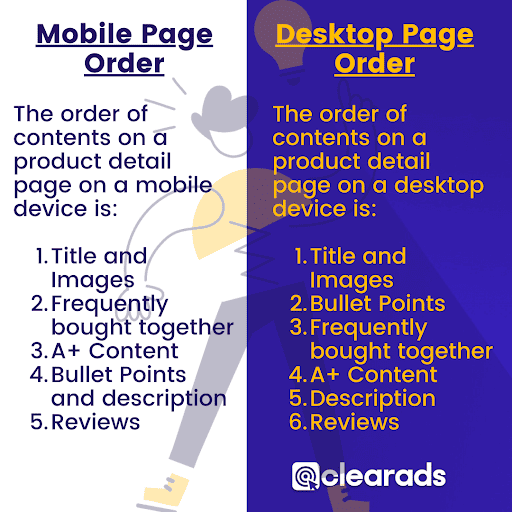
As a result, if you see that most of your sessions are from audience members using their mobile phones, you should optimize your listings this way. Taking into account the order of content on the mobile page in comparison to the desktop, e.g. that the images are larger and bullet points and descriptions are lower, you can change your content for this.
For example, if you see that mobiles are heavily used, as seen below, you can pack your description with keywords and worry less about the coherency and persuasion it has on the reader. This is because the user is not likely to even see these points unless they scroll for a long time and hence you can utilize this section to boost your SEO and feed into the algorithm.
I hope you find the updates both interesting and informative and utilize them next time you visit your business reports.