POST UPDATED: October 16, 2026
Key Takeaways
- Amazon PPC metrics fall into four groups: visibility (impressions), engagement (clicks and click-through rate), investment (Cost and cost per click) and outcome (purchases, units and sales).
- Ratios such as ACoS, ROAS and TACoS are built from those raw metrics, so they should always be recalculated from totals rather than averaged.
- A conversion rate needs a stated denominator, because Amazon uses “purchase rate” for more than one ratio.
- New-to-brand and impression share metrics add context on customer acquisition and coverage that ACoS alone cannot show.
- External benchmarks are orientation rather than targets, because category, price and campaign goal move every metric.
Amazon PPC metrics are the measures in Amazon Ads reporting that show how often ads were seen, clicked and bought from, what they cost, and how efficiently that cost turned into sales. On this page, Amazon PPC means Sponsored Ads (Sponsored Products, Sponsored Brands and Sponsored Display), measured in the Amazon Ads console. The metrics matter because each one points to a different fix, and a team that reads them in the wrong order ends up cutting bids when the real problem is the product page. This page defines each metric, gives its formula, shows which metrics suit which objective, and sets out the patterns Clear Ads uses to diagnose a change.
Which Amazon PPC metrics matter most?
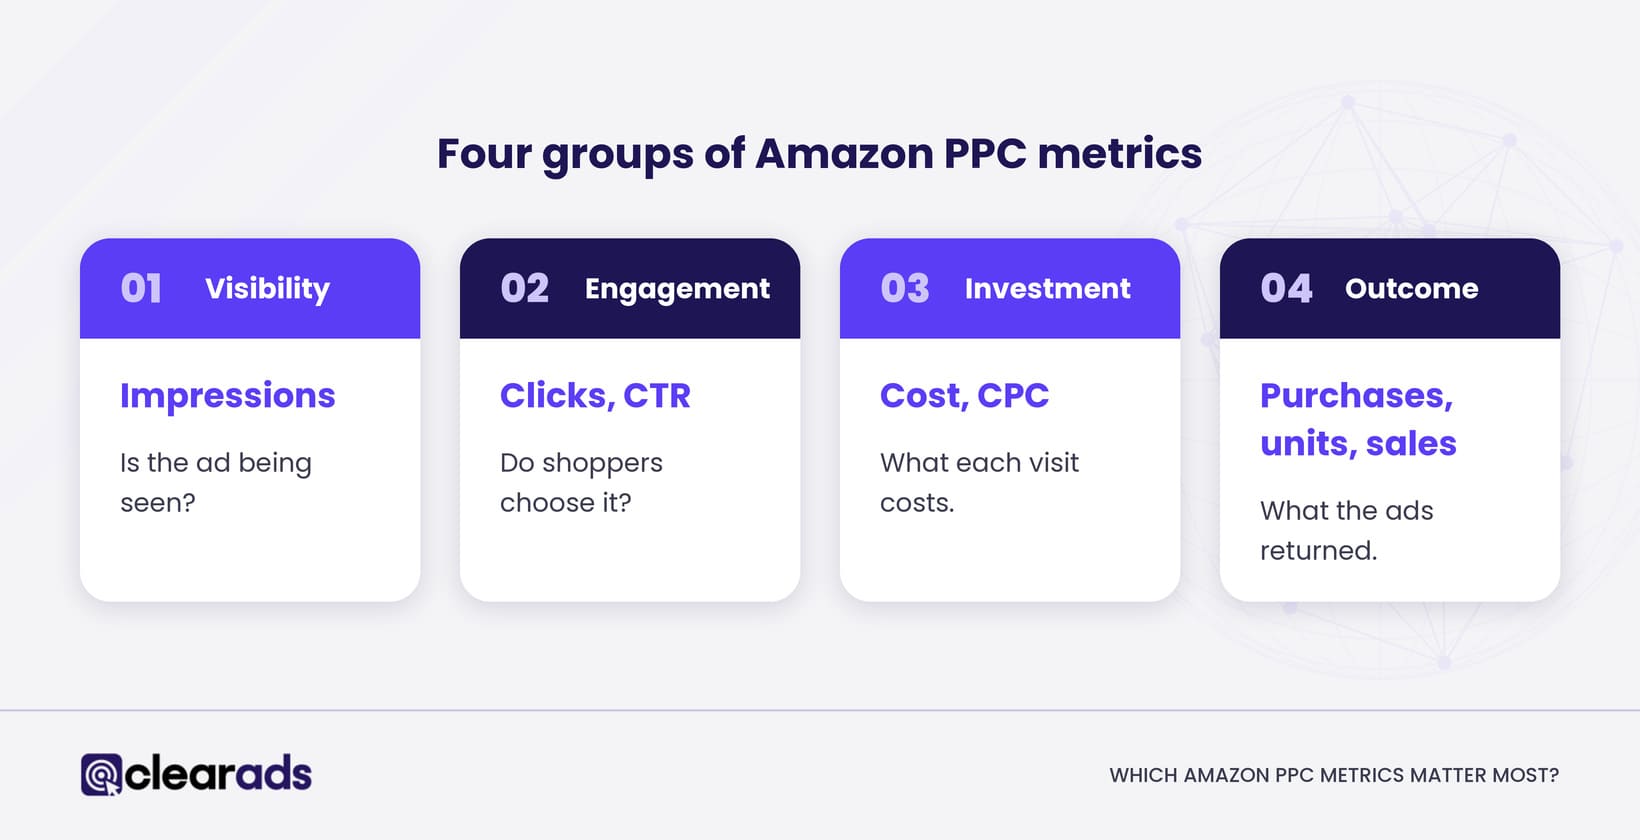
The Amazon PPC metrics that matter most are the raw counts (impressions, clicks, Cost, purchases and sales) and the ratios built from them: click-through rate, cost per click, conversion rate, ACoS, ROAS and TACoS. The table gives each formula and what it helps diagnose.
| Metric | Formula or definition | What it helps diagnose |
|---|---|---|
| Impressions | Number of times the ad was served | Reach, eligibility and auction presence |
| Clicks | Number of recorded ad clicks | Traffic volume |
| Click-through rate (CTR) | Clicks ÷ impressions × 100 | Relevance and the appeal of the search result |
| Cost | Total advertising cost | Investment and pacing |
| Cost per click (CPC) | Cost ÷ clicks | What the auction charges |
| Purchases | Attributed purchase events | Conversion volume |
| Units sold | Product units inside attributed purchases | Basket size |
| Sales | Value of attributed purchases | Attributed demand |
| ACoS | Cost ÷ ad-attributed sales × 100 | Ad cost as a share of attributed sales |
| ROAS | Ad-attributed sales ÷ Cost | Attributed sales per unit of ad cost |
| TACoS | Cost ÷ total sales × 100 | Ad cost against paid and organic sales together |
Amazon defines an impression as an ad being displayed, CTR as clicks divided by impressions, CPC as the average cost per click, Cost as total campaign spend and ROAS as sales divided by Cost.
Every ratio in the table depends on the raw counts above it, so check those first.
What do impressions, clicks, CTR and CPC tell you?
Impressions, clicks, CTR and CPC tell you whether your ads are being seen, whether shoppers choose them, and what each visit costs. Together they describe the top half of the funnel, before any purchase.
Impressions
Impressions answer “how often was the ad shown?”. Low impressions can come from low demand, weak relevance, low bids, a small budget, a paused campaign, stock or listing problems, or a target that is too narrow.
An impression does not mean the shopper noticed the ad. Some ad products also report viewable impressions, so keep served impressions and viewability metrics apart when you compare campaigns.
Clicks and click-through rate
CTR = clicks ÷ impressions × 100. CTR answers “when the ad was shown, how often did it earn a click?”.
A falling CTR can point to weaker query relevance, a less competitive main image, price or review count, or a shift in placement mix. CTR also falls when campaigns expand from high-intent terms into broader discovery traffic. CTR says nothing about whether the click paid off, so read it next to conversion rate, CPC and margin.
Cost and cost per click
CPC = Cost ÷ clicks. CPC is the average price paid for a click, set by the auction, your bid strategy, placement, relevance and competition.
A low CPC is not good if the clicks never convert, and a high CPC can be fine when conversion rate and order value support it. Calculate CPC from total Cost and total clicks, never by averaging the CPC of each row.
How are purchases, sales and conversion rate measured?
Purchases count attributed orders, units sold count the products inside them, sales measure their value, and conversion rate divides purchases by a stated denominator, usually clicks. One purchase can contain several units, so purchases and units are not interchangeable.
Sales comes in two scopes. Total sales can include halo sales, meaning other eligible products from the same seller or brand bought after the ad interaction, while promoted sales count only the advertised product. Use promoted sales when the question is about the advertised ASIN alone.
Conversion rate and purchase rate
Advertising conversion rate = click-attributed purchases ÷ clicks × 100. This is the version most teams use for Sponsored Products.
Amazon also uses the name “purchase rate” for more than one ratio, including some calculated over impressions rather than clicks, and reports separate purchase-rate-over-clicks fields in places. Always write the formula next to any conversion rate in a dashboard or client report, because two percentages with the same label can describe different stages of the funnel. The full method, with worked examples, is in the Amazon ads conversion rate guide.
How do ACoS, ROAS and TACoS relate?
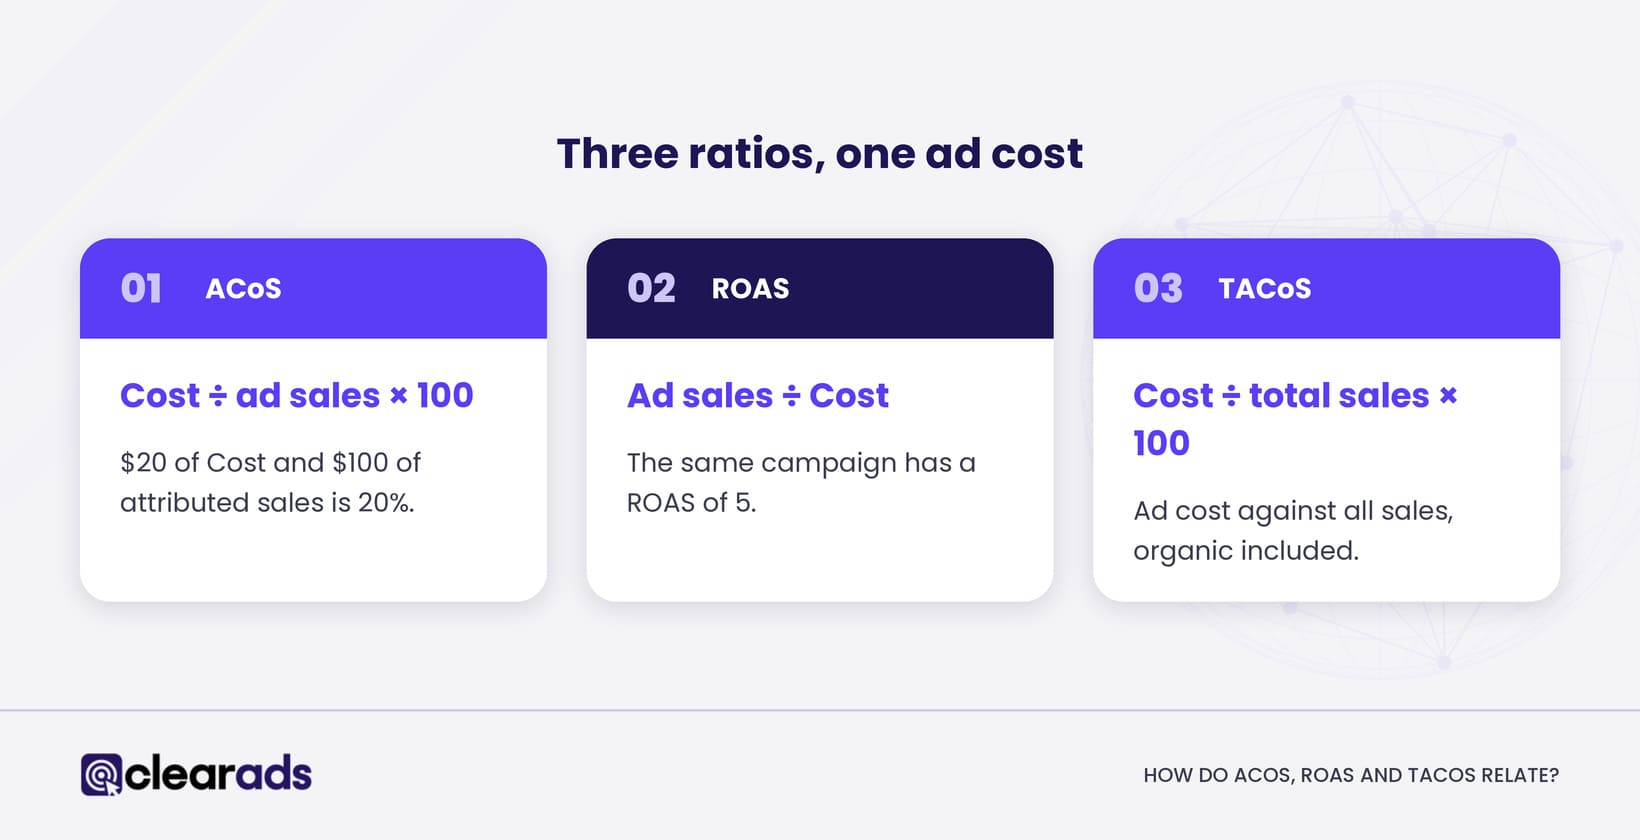
ACoS and ROAS describe the same relationship between ad cost and ad-attributed sales from opposite ends, while TACoS sets the same ad cost against all sales, organic included.
- ACoS = Cost ÷ ad-attributed sales × 100. If a campaign spends $20 (USD) and earns $100 of attributed sales, ACoS is 20%.
- ROAS = ad-attributed sales ÷ Cost. The same campaign has a ROAS of 5, so a 20% ACoS equals a ROAS of 5.
- TACoS = Cost ÷ total sales × 100. It shows how ad cost relates to the whole Amazon business, not just the sales the ads are credited with.
None of the three is profit, because each leaves out product costs, Amazon fees, fulfilment and overheads. Amazon itself says there is no universal good ACoS, because the right figure depends on margin and campaign goals. Break-even ACoS, target setting and how to read ACoS and TACoS together are covered on the ACoS, TACoS and ROAS page.
What do new-to-brand and impression share metrics add?
New-to-brand and impression share metrics add the two things ACoS cannot show: whether ads are winning new customers, and how much of the available visibility you are capturing.
New-to-brand metrics
New-to-brand metrics count attributed purchases from shoppers who had not bought from the brand on Amazon in the previous 12 months. Amazon reports new-to-brand purchases, sales, units, percentages and cost per new-to-brand purchase for eligible ad products, including Sponsored Brands, Sponsored Display and Amazon DSP.
They matter most for discovery campaigns, where winning a first-time customer usually costs more than a repeat sale. Amazon recommends reading them alongside ACoS or ROAS rather than judging brand-building campaigns on efficiency alone.
Impression share
Search term impression share is the percentage of all impressions for a search term that went to your ads, and impression rank shows your position against other advertisers on that term. Top-of-search impression share is the percentage of top-of-search impressions a target received compared with the number of times it was eligible to appear there.
Impression share measures coverage, not profit. Use it to spot visibility you are missing on terms that already convert at an acceptable cost.
Which metrics should you prioritise for each objective?
The metrics to prioritise depend on what the campaign is for, so set the objective first and choose the main metrics and guardrails from it. The table shows the pairings Clear Ads uses.
| Objective | Main metrics | Guardrails |
|---|---|---|
| Profit efficiency | Contribution profit, ACoS, ROAS | Sales volume, price, returns |
| Product launch | Impressions, clicks, purchases, query coverage | A planned spend ceiling and stock |
| Organic growth | TACoS, total sales, search query share | ACoS and rank trend |
| Customer acquisition | New-to-brand purchases, sales and cost | Repeat purchase potential and margin |
| Awareness | Reach, impressions, viewability and branded search | Frequency, cost and later engagement |
| Brand defence | Brand impression share and sales | Cannibalisation and incremental value |
How to use benchmarks
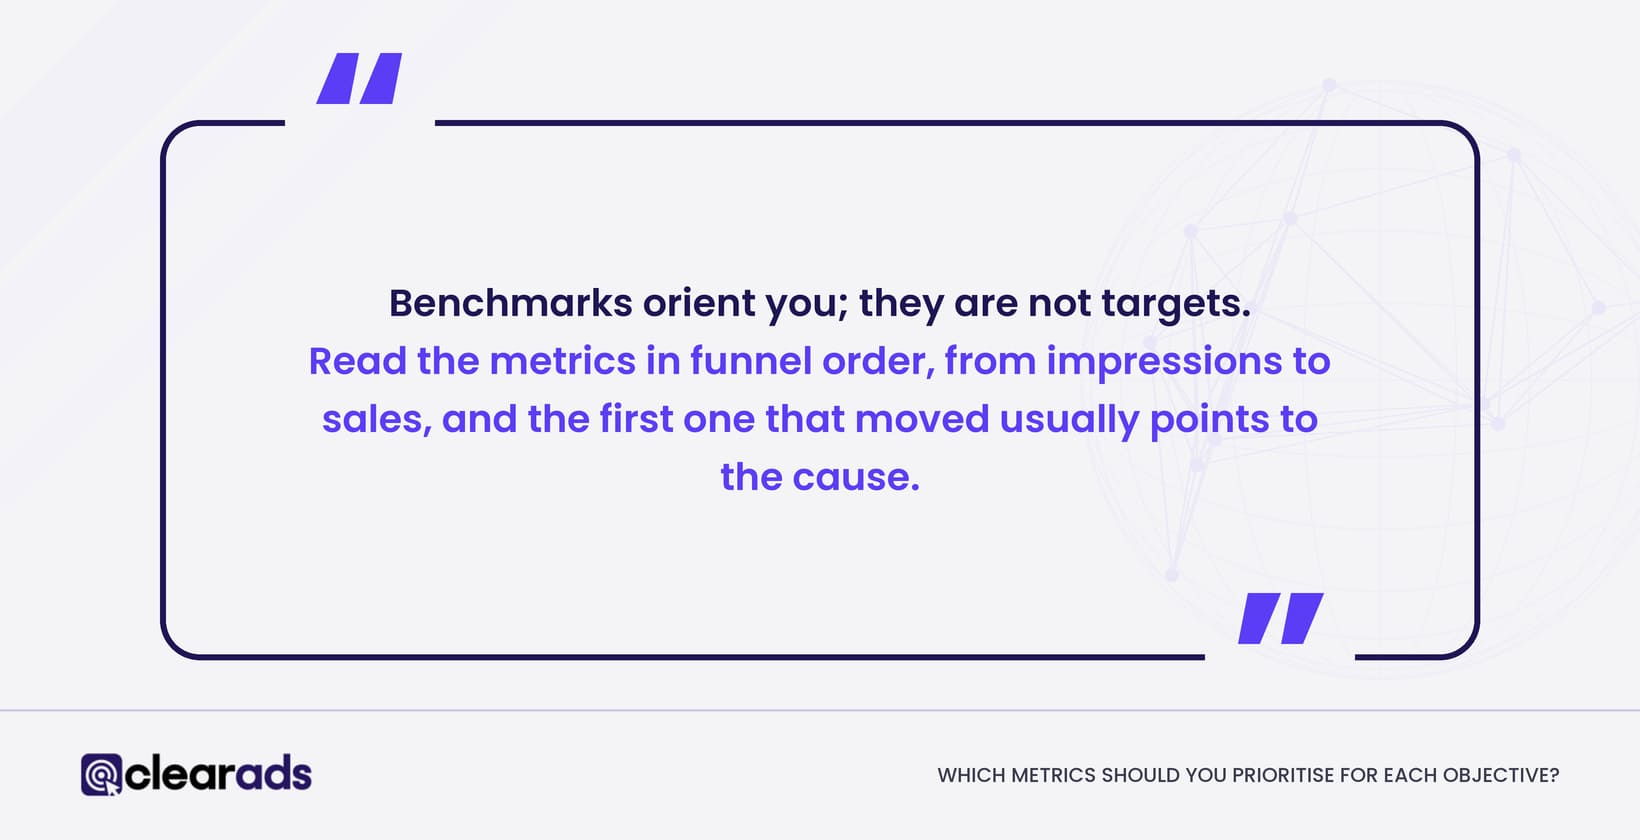
Benchmarks orient you; they are not targets. Studies published in 2026 by Amazon advertising software providers put the average conversion rate for Amazon ads at roughly 10% to 12%, while Sponsored Products conversion rates by category ranged from under 7% to over 35%. A single platform average says little about one product.
Amazon’s own benchmarks are closer to home. Since 18 May 2026, Amazon Ads benchmarks reporting has been generally available in marketplaces including the US and UK, and Brand Registry brand owners can compare click-through rate, cost per click and purchase rate (new to brand) with peer brands in their category. Compare against your category and your own history before any external average.
Diagnosing a change
When a metric moves, the table below shows the most likely explanation and the next thing to check.
| Signal | Likely explanation | Next check |
|---|---|---|
| Impressions down | Demand, eligibility, bid or budget change | Search volume, campaign status, bids and stock |
| CTR down | Weaker relevance or a less attractive offer | Query mix, placement, image, price and reviews |
| CPC up | More auction pressure or a different placement mix | Bid changes and the placement report |
| Conversion rate down | Traffic quality or a detail page problem | Search terms, price, stock and listing changes |
| ACoS up, CPC steady | Conversion rate or order value weakened | Conversion rate and average order value |
| ACoS up, conversion steady | CPC increased | Bids, competition and placement |
| TACoS up, ACoS steady | Total sales weakened relative to ad cost | Organic sales and seasonality |
| ACoS down, sales down | Efficiency bought by limiting volume | Lost impression share and budget |
Read the metrics in funnel order, from impressions to sales, and the first one that moved usually points to the cause.
Frequently asked questions
What is the most important Amazon PPC metric?
There is no single most important metric. Use contribution profit as the commercial test, ACoS or ROAS for attributed efficiency, TACoS for the whole business, and volume metrics to make sure efficiency gains are not hiding lost growth.
What is a good click-through rate for Amazon ads?
A good click-through rate depends on ad product, placement, category, brand strength and targeting, so no single figure applies. Compare against your own history and against Amazon’s benchmarks reporting for your category before adopting any general number.
Does ACoS equal profit margin?
No. ACoS includes only advertising cost and attributed sales, while profit also depends on product cost, Amazon fees, fulfilment, discounts, returns and overheads.
Why is my cost per click rising?
Cost per click usually rises when competition increases on your terms, when bids or bidding strategies change, or when more traffic shifts to expensive placements such as top of search. Check the placement report and your bid history before cutting bids, because a higher CPC can still pay if conversion rate holds.
How many impressions does it take to make a sale?
Divide one by click-through rate multiplied by conversion rate, both as decimals. At a 0.5% CTR and a 10% conversion rate, one sale needs about 2,000 impressions on average, which is why low-volume targets take time to judge.
What does this page not cover?
This page defines Amazon PPC metrics and how to read them, and leaves four topics to other pages:
- Setting a target ACoS from margin, and reading ACoS and TACoS together: ACoS, TACoS and ROAS.
- Calculating conversion rate step by step: the Amazon ads conversion rate guide.
- Choosing and reading the reports these metrics come from: how to read Amazon advertising reports.
- Setting budgets and bids: Amazon PPC budgeting and bidding strategies.
What is the next step?
Pick one objective for each campaign, write down its main metric and its guardrail from the table above, and review those two numbers every week on settled data. The Amazon PPC hub covers how campaigns, targeting and budgets fit around these metrics.
If your team tracks every metric but struggles to agree which one should drive each decision, Clear Ads Amazon PPC management sets metrics and guardrails by objective and reports against them every week.