This article starts with explaining how monitoring Amazon Ads provides clarity on customer interactions and continues by outlining how to access the Amazon Advertising dashboard and its real-time monitoring tools. It then covers how to review campaign-level metrics, dive deeper into individual campaign performance, analyse keywords, evaluate product and placement performance, and compare results across different time periods. The article further explains how to monitor competitors, optimise budgets and bids, run A/B tests, and stay updated on Amazon’s policies and features. It also discusses why monitoring Amazon Ads is important, how long ads should run, the significance of Amazon’s performance advertising, how to generate Amazon Ads reports, and finally ends with evaluating whether Amazon ad campaigns are worth it.
This article provides a complete guide to tracking and improving Amazon Ads performance. It explains how advertisers can use Amazon’s dashboards and reporting tools to monitor impressions, clicks, spend, and sales in real time. The guide walks through essential steps such as reviewing high-level metrics, analysing campaign-specific insights, refining keyword targeting, evaluating ASIN performance, and understanding how placements influence outcomes. It highlights the importance of comparing short-term and long-term trends, watching competitor activity, and optimising budgets and bids. The article also stresses the value of continuous testing, staying informed about Amazon’s advertising updates, and maintaining strong monitoring habits to reduce wasted spend and improve ROI. It concludes by outlining when campaigns should continue running, how attribution is measured, how to generate key reports, and whether Amazon advertising is ultimately profitable.
How to Monitor Amazon Ads?
Monitoring Amazon Ads creates clarity on how customers interact with advertisements across Amazon’s shopping, streaming, and browsing environments. The process relies on a continuous review of impressions, clicks, costs, conversions, and audience signals that Amazon provides through its measurement and reporting systems.
Amazon’s reporting environment offers performance indicators for Sponsored Products, Sponsored Brands, Sponsored Display, and Amazon DSP. These indicators show the impact of targeting, bidding, and creative settings on overall campaign output. Monitoring also highlights changes in reach, frequency, CTR, ACoS, ROAS, and product-level sales patterns, which are essential for determining efficiency and long-term scalability. By reviewing these signals at regular intervals, advertisers maintain a clear understanding of how each campaign contributes to cumulative results.
Below are the steps to monitor Amazon Ads.
1. Access the Amazon advertising dashboard
Accessing the Amazon Advertising dashboard provides direct visibility into impressions, clicks, spend, and revenue data. This access creates a central space where campaign performance, audience insights, and keyword activity appear in one interface that supports accurate decision-making. The dashboard functions as an organised hub for monitoring activity. Each metric appears in real time, giving a clearer understanding of how campaigns perform across different formats and time periods.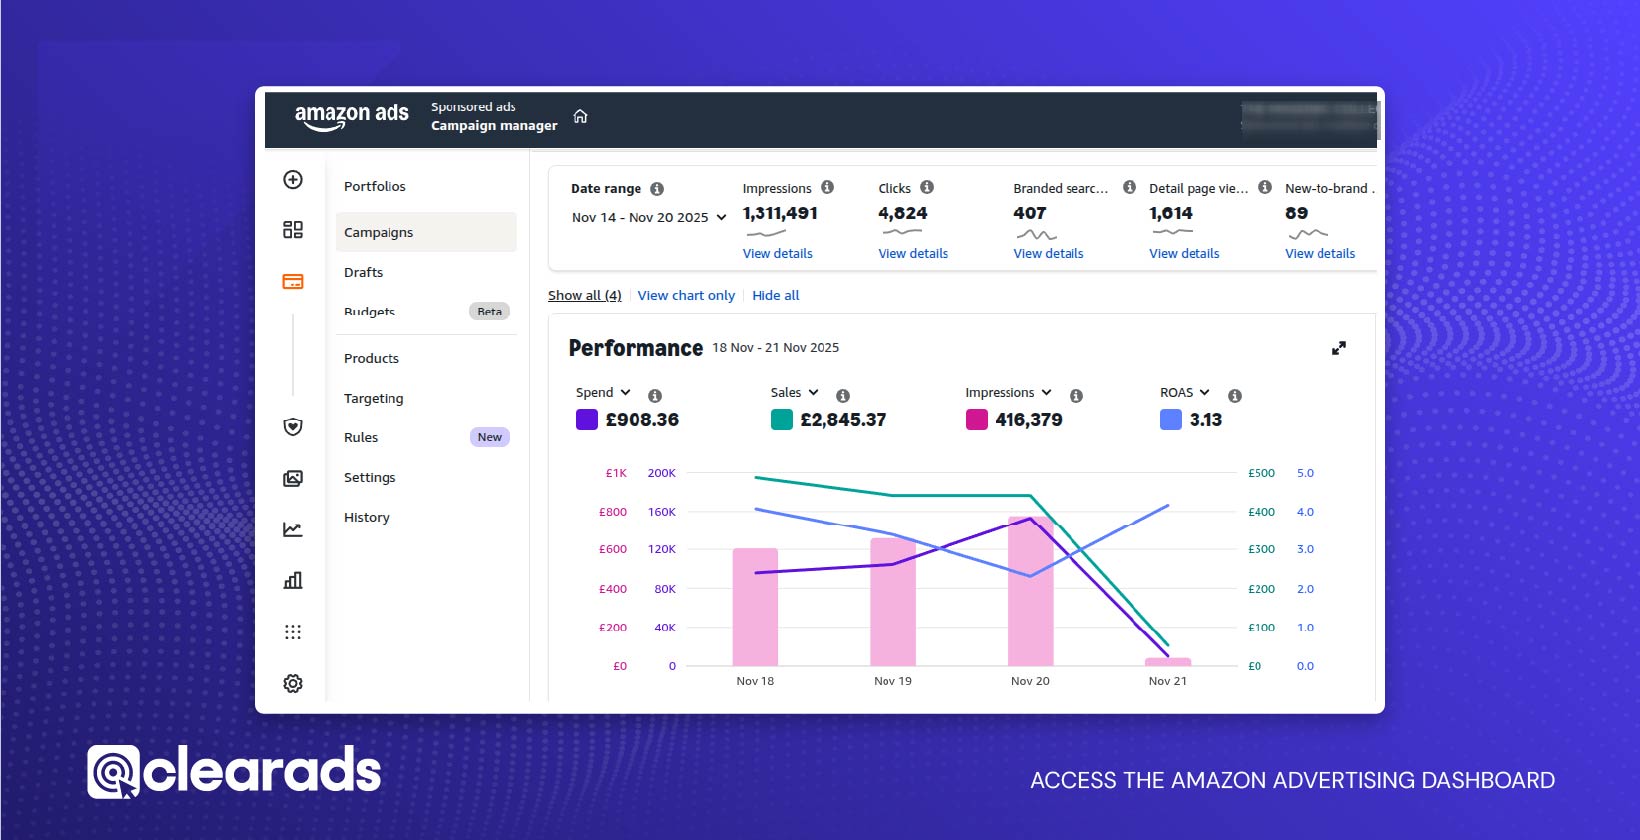
Where to find core monitoring tools?
The monitoring tools sit inside the Amazon Ads interface, where the navigation layout groups metrics and reporting options into a structured control panel. The dashboard presents impressions, clicks, sales, and audience signals drawn from Amazon’s ad ecosystem. These tools provide access to campaign reporting, retail insights, and attribution indicators across Amazon’s properties. The interface includes reporting on reach, frequency, viewability, and off-Amazon conversions, delivering a complete view of campaign impact.
A broader analytical view appears when using dashboard solutions. These dashboards visualise Amazon PPC metrics, such as ACoS, ROAS, sales, and ad spend, supporting a consistent review process.
How to use real-time metrics in the dashboard?
Real-time metrics show impressions, clicks, spend patterns, and sales activity as they occur. These metrics help determine the effect of targeting settings and bid positions during active periods. Advertisers gain access to impressions, clicks, new customers, and engagement data. These indicators present immediate signals that reveal how customers respond to ads on the same day. Real-time changes highlight shifts in visibility and engagement by showing the direct impact of campaign adjustments.
2. Review campaign overview metrics
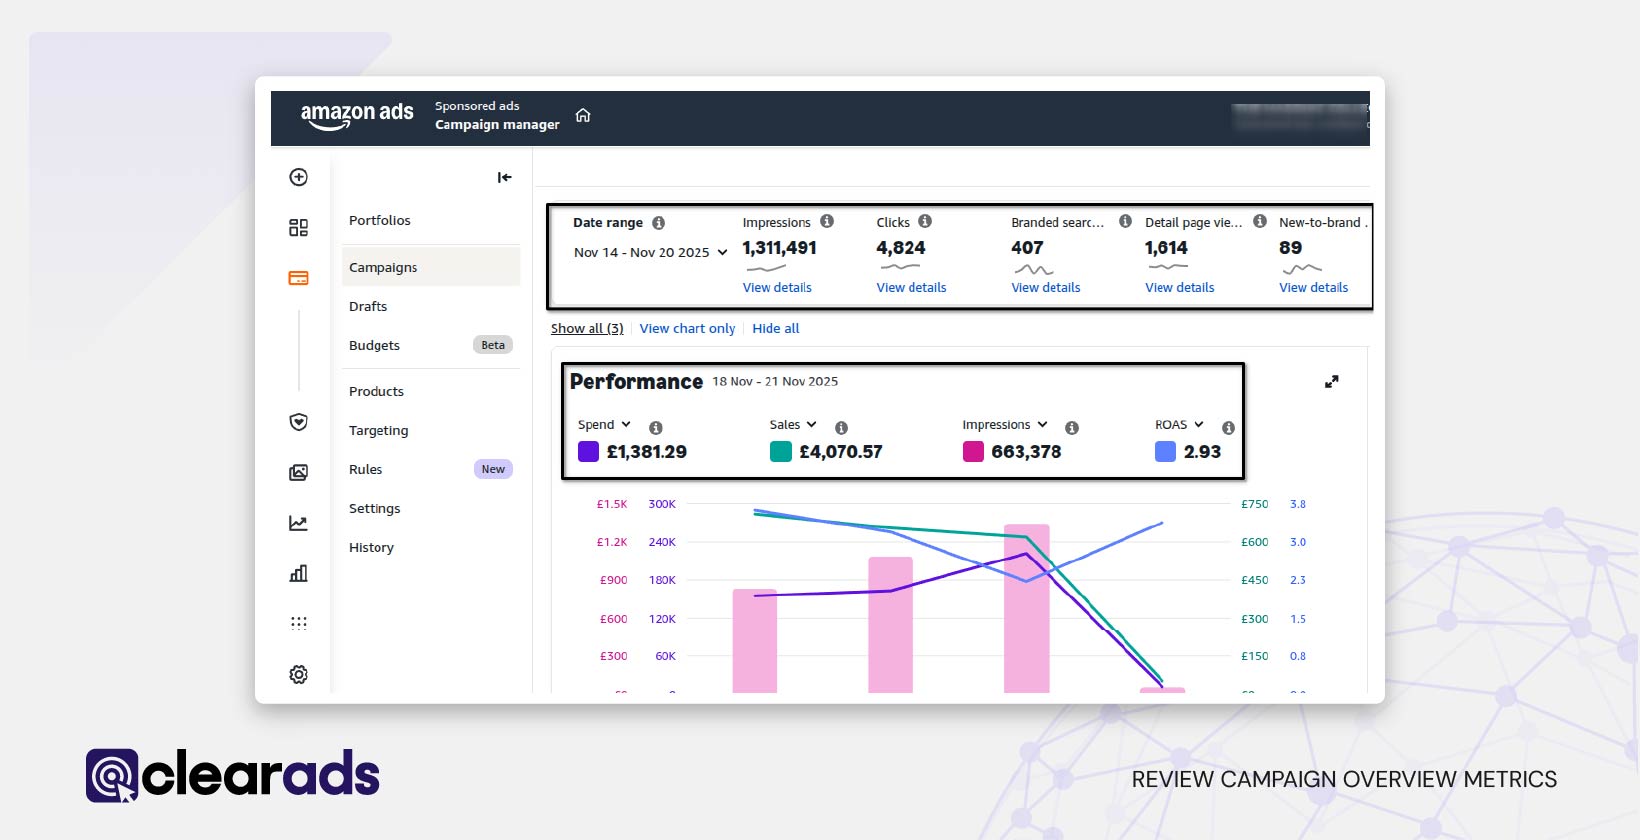
Reviewing campaign overview metrics offers a clear view of overall performance across active advertisements. The dashboard presents visibility data, engagement signals, cost indicators, and revenue outcomes in one place. These combined measurements show whether campaigns are gaining sufficient reach, attracting meaningful interaction, and generating attributed sales. Assessing these high-level patterns establishes the baseline for deeper optimisation and ensures early detection of changes in performance quality.
Which metrics offer the fastest performance signals?
The fastest signals come from visibility and engagement indicators that update frequently. Exposure levels show whether ads appear consistently to audiences, while interaction levels reveal their immediate relevance. Changes in these indicators highlight early shifts in audience response or competitive pressure, helping identify issues before they affect cost or sales outcomes. These early signals guide rapid decision-making and prevent broader inefficiencies.
How to interpret clicks, impressions, spend, and sales?
Interpreting these four indicators requires observing how they move together over identical timeframes. Exposure shows how often ads appear, interaction shows audience interest, spend reflects financial input, and attributed sales represent the resulting revenue. When interaction rises proportionally with exposure, relevance strengthens. When revenue grows faster than spend, efficiency increases. When spend rises without proportional revenue, the campaign loses effectiveness. Reading these relationships together provides a complete view of campaign health and identifies where adjustments are needed.
3. Dive deeper into individual campaign performance

Diving deeper into individual campaign performance helps reveal how much each campaign contributes to reach, engagement, and revenue. Visibility indicators, engagement signals, cost measures, and revenue outcomes reveal strengths and weaknesses within each campaign.
Keyword behaviour, audience activity, placements, and product-level contribution offer further clarity into performance stability and targeting accuracy.
Analysing these components highlights variation across targeting groups, placements, and search terms, helping uncover high-performing elements to scale and weak components to refine. Reviewing campaigns individually ensures optimisation decisions are precise rather than broad.
How to identify underperforming campaigns?
Underperforming campaigns can be identified when interaction levels, conversion patterns, and cost trends become misaligned. Low engagement signals weak relevance, high click activity with limited conversions suggests product-page or audience mismatch, and escalating costs indicate competitive pressure or inefficient bids.
Exposure, interaction, and sales data displayed together make it easier to recognise campaigns attracting traffic but failing to convert, signalling wasted budget or structural issues. Such patterns highlight which campaigns require targeting updates, bid modifications, or placement adjustments.
How to track campaign efficiency using ACoS and ROAS?
Tracking ACoS and ROAS shows the cost-effectiveness of each campaign and the value generated from ad spend. Rising ACoS without matching sales signals declining profitability, while falling ROAS indicates weaker revenue return.
A healthy ACoS range for many campaigns often sits between 10% and 20%, depending on category and margins. Comparing these metrics across campaigns helps identify scalable performers and campaigns that require refinement or pausing. Continuous monitoring links bidding choices and targeting structure with measurable financial impact.
4. Analyse keyword performance
Analysing keyword performance reveals how search behaviour shapes visibility, engagement, and revenue. Keyword-level metrics show which terms generate meaningful exposure, which attract genuine interest, and which drive cost-efficient conversions. Reviewing these patterns enables smarter optimisation of bids, match types, and targeting selections, helping reduce wasted spend and improve campaign relevance. Understanding how keywords influence traffic quality also supports better profitability and long-term scaling strategies.
How to review search term reports?
Search term reports reveal the exact words or ASINs that trigger ads, showing which customer queries align with your offers. These insights highlight high-intent search behaviour and expose terms that generate clicks without conversions. Consistently high-performing terms can be added as exact keywords, while inefficient terms can be marked as negatives to prevent budget leakage. Frequent review ensures evolving customer behaviour is captured and applied to future keyword improvements.
How to track bid efficiency by keyword match type?
Tracking bid efficiency requires understanding how broad, phrase, and exact match types influence exposure and cost. Match-type data reveals whether wider queries generate relevant traffic or unnecessary spend, and whether precise searches justify higher bid levels. Reviewing performance across match types helps identify where bids should be raised to scale strong patterns and reduced to minimise waste. This structured approach ensures spending aligns with the most profitable search behaviours.
5. Evaluate product performance within campaigns
Evaluating product performance helps reveal how individual ASINs contribute to campaign visibility, engagement, and sales. Product-level metrics show how customers interact with each listing, how often they convert, and whether they are new or returning buyers. Reviewing these signals highlights strong performers to scale and weak performers that require listing optimisation, pricing adjustments, or refined targeting. Product-level reporting also reveals how promoted ASINs and related catalogue items contribute to overall revenue.
How to analyse ASIN-level metrics?
Analysing ASIN performance involves comparing visibility, engagement, and conversion outcomes for each product. High exposure with weak conversions indicates optimisation needs in imagery, descriptions, or relevance. Strong performance suggests that product pages effectively support customer decisions. Additional engagement data, such as detail page views and new-to-brand activity, helps confirm how well each ASIN resonates with shoppers. These insights guide decisions on scaling, refining, or restructuring product-focused strategies.
How to Identify Product Cross-Performance Trends?
Cross-performance trends appear when customers engage with one ASIN but purchase another, indicating cross-selling potential. Tracking these behaviours helps identify complementary products, bundling opportunities, and catalogue relationships that influence purchasing decisions. Broader activity signals, such as how often customers navigate from one ASIN to another after an ad click, provide additional insight into catalogue alignment and product grouping strategies. These patterns support more effective targeting and campaign structuring across multiple ASINs.
6. Review ad placement performance
Reviewing ad placement performance shows how positions such as top-of-search, rest-of-search, and product page placements influence visibility, cost, and conversions. Placement data reveals how customers interact with ads in different browsing contexts, offering clarity on which positions deliver strong engagement and which reduce cost efficiency. Comparative placement reporting provides actionable insights into where visibility is highest and where conversions are most reliable.
How to evaluate top-of-search vs rest-of-search?
Evaluating top-of-search and rest-of-search requires comparing visibility, engagement, and cost patterns across each placement. Clear separation of placement results reveals where attention is strongest and where performance declines. Additional viewability and engagement indicators reveal how often customers see, interact with, and respond to ads across each placement type. Reviewing these comparisons helps determine which placements provide meaningful results and which require bid or targeting adjustments.
How to adjust placements for improved visibility?
Improving placement performance requires modifying bid multipliers based on observed outcomes. Increasing bid strength for top-performing placements can significantly boost visibility for high-potential keywords, while reducing bids for weaker placements helps maintain cost efficiency. Reach and frequency signals help determine where additional spend delivers the greatest return and where exposure can be safely reduced.
7. Compare performance over different time periods
Comparing performance across different time periods helps reveal how visibility, cost patterns, and revenue trends evolve as campaigns run. Time-based reports provide access to historical data ranging from short-term search term activity to long-term campaign summaries. Reviewing changes in impressions, spending, and sales across selected intervals shows how campaigns respond to shifts in traffic and competition over time. Dashboards that display side-by-side time windows make these patterns easier to interpret. This perspective helps determine whether recent adjustments lead to sustainable improvement or temporary fluctuations.
How to compare short-term and long-term trends?
Comparing short-term and long-term trends involves analysing daily or weekly changes alongside broader monthly or quarterly shifts. Short-term variations reflect immediate responses to bid updates or keyword adjustments, while long-term patterns reveal sustained movement rather than isolated spikes. Dashboards that visualise sequential data show whether short-term improvements repeat consistently, indicating deeper structural gains. Distinguishing between temporary volatility and meaningful trend development ensures smarter, more stable optimisation decisions.
8. Monitor competitors’ ads for insights
Monitoring competitors’ ads provides essential context on how rival brands position their products, adjust bids, and capture visibility. Competitive shifts often influence impression share, CPC behaviour, and keyword performance, revealing how aggressively others compete in your category. Reviewing keyword patterns, listing quality, and targeting approaches helps identify gaps in your coverage and opportunities to strengthen strategy. These observations support more informed decisions on bidding, keyword refinement, and creative improvements.
How to identify competitor bidding behaviour?
Competitor bidding behaviour becomes visible through changes in CPC, impression share, and placement consistency. Rising CPC values often signal increased bidding pressure from competing brands. Declines in impression share across established keywords can indicate that competitors have refined targeting or increased spend. Search term performance shifts, especially drops in clicks or conversions, also reflect rising competition for high-value queries. Identifying these signals helps determine when to adjust bids to protect visibility or when to focus on less contested opportunities.
9. Optimise budget and bidding strategies
Optimising budget allocation and bidding strategies ensures campaigns remain active during peak hours, maintain cost efficiency, and capture the highest-value traffic. Budgets determine daily visibility, and campaigns that deplete funds early lose out on profitable conversions later in the day. Effective optimisation focuses on directing budget toward high-performing segments while reducing exposure to low-value traffic.
How to analyse budget depletion patterns?
Analysing budget depletion patterns requires checking how early campaigns stop serving ads due to limited daily allocation. Time-stamped spend and impression data show when ads disappear from auctions, revealing lost visibility and missed conversions. Early depletion in strong campaigns suggests the need for increased budgets, while consistent spend in weak campaigns signals overspending. Reviewing these patterns ensures that high-value opportunities receive adequate investment.
How to adjust bids by performance tier?
Adjusting bids based on performance tiers creates a clear, scalable bidding structure. High-performing keywords, those with efficient costs and reliable conversions, can support higher bids to capture more visibility. Campaign dashboards that display CPC, ACoS, ROAS, and conversion behaviour help group terms into performance tiers for structured optimisation. Increasing bids for top-tier terms, moderating mid-tier bids, and reducing or removing low-performing terms ensure that the budget is used where returns are strongest.
10. Conduct A/B testing for creatives, keywords, and targeting
A/B testing provides clear evidence on which creative elements, keyword strategies, or targeting settings deliver stronger results. Testing variations under controlled conditions allows advertisers to isolate individual factors and measure audience response. Performance metrics, such as impressions, clicks, customer engagement, and attribution signals, help compare versions objectively. Detailed variant-level reporting makes it possible to identify which configuration drives more efficient traffic and stronger sales.
How to Compare Test Results Using Amazon Metrics
Comparing A/B test results relies on reviewing engagement and efficiency indicators across both variants. Higher CTR reflects stronger relevance, while lower CPC indicates better cost performance. Conversion rate, ACoS, ROAS, and attributed sales show which version delivers stronger profitability. Variant-level reporting simplifies comparison by presenting identical metrics for each configuration. Reviewing these data points reveals which version should be scaled and which should be retired.
11. Stay updated on Amazon’s advertising policies and features
Staying updated on Amazon’s advertising policies and features ensures that campaign monitoring remains accurate and aligned with current measurement standards. System updates influence how metrics such as visibility, engagement, cost, and attribution are calculated, making regular review essential for correct interpretation. Platform changes may introduce new metrics, adjust attribution windows, refine invalid traffic handling, or add advanced reporting categories, all of which impact how performance is evaluated. Keeping track of these developments prevents outdated assumptions and supports more precise optimisation.
How to track new tools and reporting improvements?
Tracking new tools and reporting improvements involves routinely reviewing Amazon’s measurement updates and exploring newly available analytics features. Enhancements such as Amazon Marketing Stream, Amazon Marketing Cloud, omnichannel metrics, and brand lift studies expand visibility into customer behaviour across touchpoints. Additional updates to bidding automation, budget controls, and dynamic optimisation further influence how advertisers monitor performance.
Why it is important to monitor Amazon Ads?
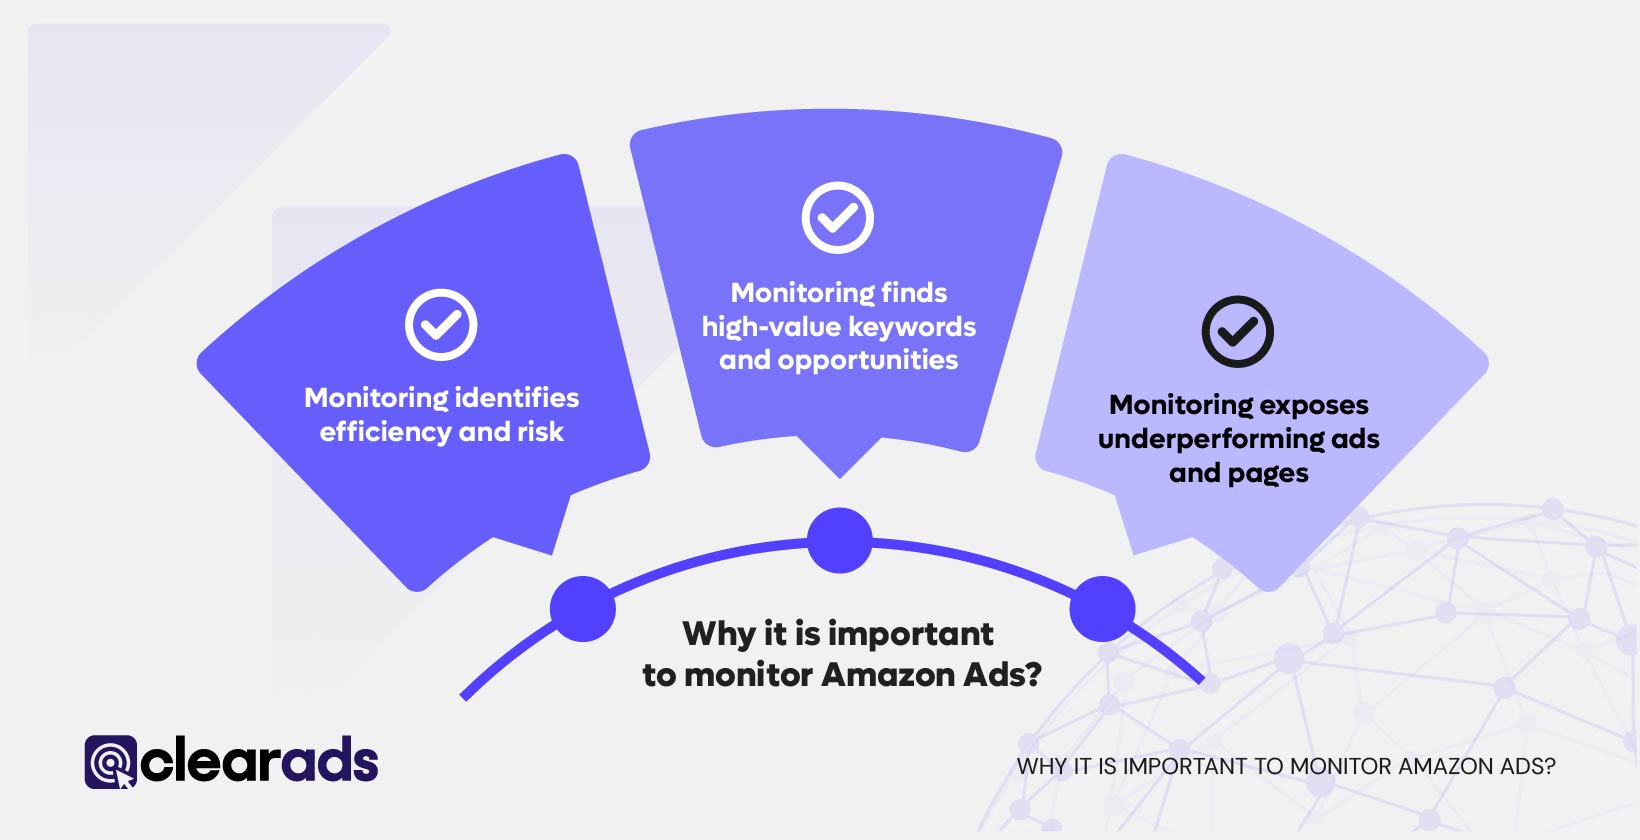
Monitoring Amazon Ads protects profitability, reveals actionable insights, and ensures that spending produces measurable returns. Continuous review converts raw data into decisions that support scaling, refinement, or cost reduction across campaigns.
1. Monitoring identifies efficiency and risk
Monitoring shows whether spend generates proportional sales or only increases traffic. Metrics such as ACoS and TACoS quantify cost vs. revenue relationships, with common healthy ranges at 10–20% (ACoS) and 5–10% (TACoS). Early changes in these values help detect rising cost and declining efficiency.
2. Monitoring finds high-value keywords and opportunities
Search term and keyword reports highlight profitable terms and reveal new high-intent phrases that improve campaign coverage and eliminate wasted spend.
3. Monitoring exposes underperforming ads and pages
CTR, conversion rate, and ACoS provide direct signals of where the performance funnel weakens. Because CTR and conversion rate differ from product to product and vary by category, product type, and price point, each metric is evaluated against historical data and category norms rather than fixed benchmarks. A rapid decline in CTR indicates reduced relevance or weak creative, and a decline in conversion rate indicates issues on the product detail page, such as pricing, reviews, or incomplete content. Tracking these movements isolates the exact stage of the journey that requires optimisation.
4. Monitoring enables timely budget and bid action
Daily spend patterns reveal when campaigns run out of budget or overspend on weak targets. Monitoring identifies which campaigns should receive additional budget and which should be reduced or paused.
5. Monitoring detects market and behavioural shifts
Comparing performance over time uncovers seasonality, competitive pressure, and shifts in shopper behaviour, allowing pre-emptive adjustments.
6. Monitoring supports automation and testing
Accurate data makes automation, such as dynamic bidding and automated rules, more effective, and enables reliable A/B testing with clean, measurable outcomes.
Practical outcome
Consistent monitoring supports a simple cycle:
Scale what works → Fix what underperforms → Cut what wastes budget.
This sequence drives long-term margin stability and growth.
How long is it appropriate to run Amazon Ads?
It is appropriate to run Amazon Ads for at least 14 days to a few weeks to allow the Amazon algorithm to gather enough data and stabilise campaign performance. Amazon recommends waiting a minimum of 14 days before making major optimisation decisions, as attribution and learning take time to complete.
The longer-term impact of Amazon Ads, such as improving organic ranking or driving sustained profitability, typically requires multiple months of consistent advertising. Industry research indicates that meaningful changes in organic visibility and brand momentum often take 3 or more months of continuous optimisation.
However, the ideal duration depends on performance stability rather than fixed timelines. Campaigns should be monitored through key metrics such as ACoS, CPC, CTR, impressions, and conversion rate. High-performing campaigns can run indefinitely, while those showing declining efficiency may need refinement, restructuring, or pausing. Some campaigns work year-round, while others have shorter lifespans depending on performance goals and seasonality.
How significant is Amazon’s performance advertising?
Amazon’s performance advertising is highly significant due to its granular measurement capabilities. It captures billions of cross-device interactions and provides insights into impressions, engagement, new-to-brand behaviour, reach, frequency, and attribution outcomes. This depth of data allows advertisers to analyse every stage of customer discovery and purchase behaviour, enabling precise optimisation decisions across all campaign types.
How to generate Amazon Ads reports?
Amazon Ads reports are created within the advertising console by selecting report categories, defining time ranges, and generating downloadable files. The reporting process supports multiple report types, including search term, targeting, campaign, placement, and product-level outputs. Each report includes critical performance indicators that reveal traffic quality and cost efficiency. Different platforms store varying time ranges, such as 60–90 days for search term and product reports, making regular downloads essential to preserve historical insights.
How does Amazon DSP measures attribution?
Amazon DSP measures attribution using aggregated event-level behavioural data processed through Amazon Marketing Cloud. Insights include reach, frequency, viewability, and conversion contributions across devices and channels. These signals quantify both on-Amazon and off-Amazon influence, showing how ads shape customer journeys in a privacy-safe, anonymised format.
Are Amazon ad campaigns worth it?
Amazon ad campaigns are worth the investment when they sustain efficient costs and consistent sales outcomes. Strong campaigns typically show healthy CTR (≥0.5%), conversion rates around 10–15%, and ACoS in the 10–20% range. Campaigns that produce strong ROAS, stable impressions, and predictable conversions demonstrate profitable performance. When metrics weaken, optimisation or pausing becomes necessary to maintain sustainable returns.