Amazon conversion rate vs category is the permission check. If your brand converts better than the category average on a search term, you have a reason to buy more visibility. If it converts worse, more traffic makes the gap more expensive. The Search Query Performance report in Brand Analytics is where that comparison lives.
Why isolated conversion rates mislead
Most Amazon dashboards report your numbers and stop there. Campaign Manager shows spend and sales. Business Reports show sessions and unit session percentage. None of them tell you whether the rest of the category is doing better on the same search.
A conversion rate that looks acceptable in isolation can sit below the category line. A modest rate can sit above it. Without that comparison you are deciding whether to scale from a number that has no context.
This is not a keyword-research problem. It is a relative-performance problem. The question is not “how many people search this.” The question is “when they search it, do we earn the click and the sale better than the market — and if we do, how much of that market do we actually own?”
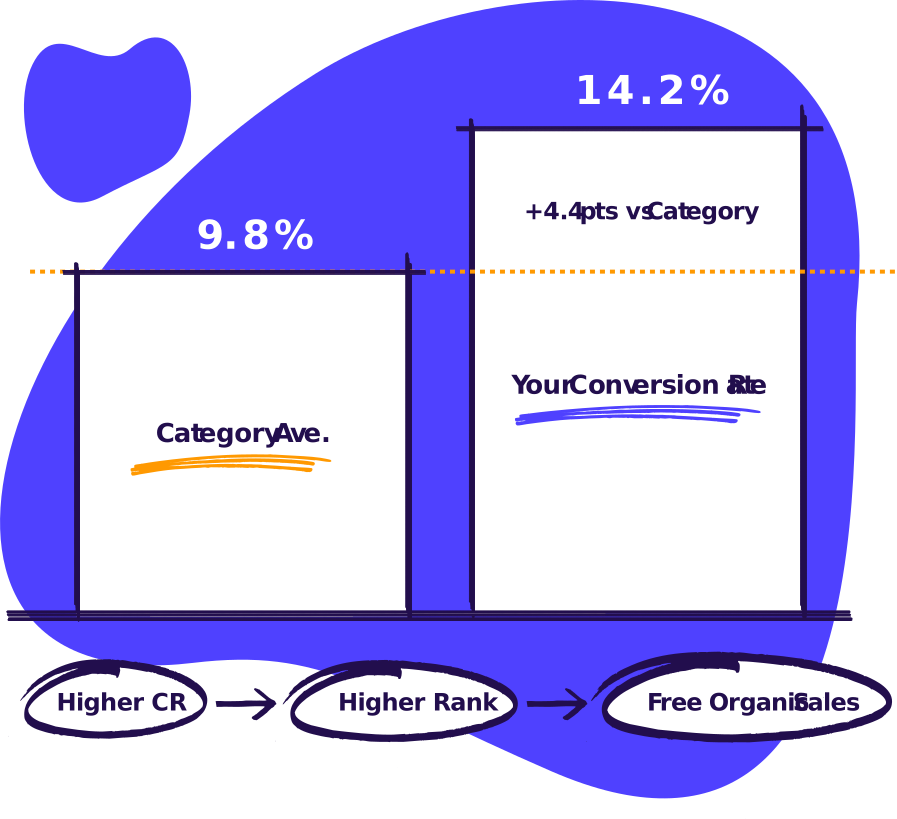
The metric that decides your organic rank
If you out convert the category, you’ll climb organic and sell more at a lower TACoS
Where the comparison lives
Amazon conversion rate vs category is not a metric Amazon prints as a single score. You calculate it from the Search Query Performance (SQP) report in Brand Analytics.
Path, from trade write-ups of Seller Central (AdBrew; Parker-Lambert): Brands → Brand Analytics → Search Query Performance. Amazon’s own Seller Central help page for this report is login-walled, so this post does not quote official help text.
The report has two views. Brand view rolls every ASIN in the brand into one set of counts. ASIN view is one product at a time. This check uses Brand view. That is how a shopper meets the brand in search. If your export columns say ASIN Count instead of Brand Count, you have the wrong file. Re-export Brand view. Do not substitute ASIN data and call it a brand result.
Trade sources (Kapoq; AdBrew) describe Brand Analytics as a Brand Registry Seller Central feature. Kapoq states it is not available for Vendors, and that the Selling Partner API currently returns ASIN-view data only. Amazon’s SP-API documents the report type GET_BRAND_ANALYTICS_SEARCH_QUERY_PERFORMANCE_REPORT as available to Brand Registry sellers in North America, Europe (including the UK), and the Far East. It is not a UK-only or US-only product.
A later guide — scheduled for October, targeting “amazon search query performance” — covers how to export the file and read every column. This post is the decision the file is for.
Sum the counts, then divide
Do not average the rates Amazon shows on each row. Sum first.
- Brand CTR = sum of Clicks: Brand Count ÷ sum of Impressions: Brand Count × 100
- Category CTR = sum of Clicks: Total Count ÷ sum of Impressions: Total Count × 100
- Brand CVR = sum of Purchases: Brand Count ÷ sum of Clicks: Brand Count × 100
- Category CVR = sum of Purchases: Total Count ÷ sum of Clicks: Total Count × 100
- Purchase share = sum of Purchases: Brand Count ÷ sum of Purchases: Total Count × 100
Report the value and the multiple of category (for example, brand CVR is 1.15× category). Purchase share is the size of the prize, not a performance metric. A brand can convert well and still own a thin slice of the purchases on that term. That slice is the opportunity.
There is no published industry-average CTR or CVR that applies across Amazon. Do not replace your category line with a generic “good conversion rate.”
Four cases — the permission check
Once brand and category sit on the same page for both CTR and CVR, you get one of four pictures.
CTR above category, CVR above category. You earn the click and the sale better than the market. The constraint is visibility. Buying more impressions — through ads, ranking work, or both — is the logical next step. This is the case Amazon Marketing Services is built for: spend on the terms you already win, not on the terms the category wins against you.
CTR above category, CVR below category. Shoppers click you, then leave. Scaling spend here pays for a leak. Fix the listing, the offer, or the post-click experience before you buy more traffic. When the page and the ads both need to move, that is full-service management, not a bid change.
CTR below category, CVR above category. When shoppers do click, they buy. They are not clicking enough. The problem sits on the search results page: main image, title, price presentation, badge, or position. Fix presentation before you treat this as a conversion problem.
CTR below category, CVR below category. You are not winning the click or the sale. Do not scale spend. Diagnose the offer and the page. Amazon consulting is the conversation when you want that diagnosis without handing the account over.
Those four cases are the whole permission check. Everything else in the report is detail.
The metric that decides your organic rank
If you out convert the category, you’ll climb organic and sell more at a lower TACoS
The growth list: terms you convert, and barely own
The brand-level picture can hide the useful rows. The growth list is the set of search terms where:
- Brand clicks are greater than 2
- Category purchases are greater than 10
- Brand CVR is above category CVR on that term
Sort by category purchases, largest first. Take the top ten. Split branded terms out so they do not flatter the list. Parker-Lambert’s write-up of this report is clear on that split: branded queries usually show higher CTR and CVR because the shopper already chose you. That is expected. It is not evidence you beat the category on discovery terms.
What you usually find is a short set of unbranded terms where you already convert better than the market and still capture a small share of the purchases. Those are the terms worth ranking and advertising against — not because a tool estimated volume, but because the category is already buying and you close better than average.
One anonymised example from work already done on this flow: a snack brand converting 15% better than its category, capturing 0.62% of it. Nearly 39,000 monthly purchases on one search term. That is not a keyword-research finding. It is a share gap on a term the brand already wins.
If you spend against the inverse — high-volume terms where you convert below category — you are buying the market’s leftover shoppers.
The cart-add leak
SQP also breaks the path into cart-adds. Two stages matter:
- Cart-adds ÷ clicks — did the listing earn the basket?
- Purchases ÷ cart-adds — did the basket become an order?
Flag queries with at least five brand cart-adds where your stage-2 close rate is five percentage points or more below the category. Those are shoppers who wanted the product and then stopped. That is usually price at checkout, delivery promise, stock, or a competing offer — not a title problem.
Treat that list as a diagnostic, not as a reconciliation to Business Reports. Parker-Lambert and Kapoq both describe a 24-hour attribution window on purchase metrics in this report: a search on Monday and a purchase on Tuesday can show the click and not the purchase. Kapoq also notes that cancelled and returned orders can remain in the purchase counts.
What to do with the result
If you beat the category on conversion and still own a sliver of the purchases, the work is visibility on those terms, presentation on the terms where CTR is the gap, and a hard stop on scaling the terms where CVR is below category.
If you do not beat the category, the work is the offer and the page. More traffic will not fix that.
PPC is how you buy the visibility you now have permission for. It is not how you discover whether you had it. See Amazon PPC for campaign mechanics and pricing if the account is coming to us.
Run the check on your own file
You do not need to build the spreadsheet from scratch.
Download Beat the Category — the SQP Opportunity Finder skill plus the short guide. Upload a Brand-view Search Query Performance export. It returns a written report: brand versus category on CTR and CVR, the growth list, and the cart-add leak. It does not produce a slide deck.
If you spend $20,000 or more a month on Amazon ads and the report shows a share gap you cannot close in-house, the next step is the same one already on the site: Get My Free Audit.
The metric that decides your organic rank
If you out convert the category, you’ll climb organic and sell more at a lower TACoS
Frequently Asked Questions
What does Amazon conversion rate vs category actually measure?
It measures whether your brand turns clicks into purchases at a higher or lower rate than the rest of the market on the same search terms, in the same date range. You calculate it from Search Query Performance counts: brand purchases ÷ brand clicks, against total purchases ÷ total clicks. It is a relative check, not a single Amazon score.
Where do I find Amazon conversion rate vs category data?
In Seller Central: Brands → Brand Analytics → Search Query Performance, Brand view. Export the file and sum the counts before you divide. Amazon’s public help page for this report is login-walled; the path above is from trade write-ups of the current Seller Central navigation.
Should I use Brand view or ASIN view?
Use Brand view for the permission check. Brand view is the brand as it appears across search. ASIN view is one product. If the columns say ASIN Count, re-export Brand view. Do not mix them.
What is a good Amazon conversion rate vs category?
There is no published cross-category number that applies to every brand. The only useful comparison is your brand rate against the category rate on the same terms in the same period. Above category, with a small purchase share, is the growth case. Below category is a reason not to scale.
Why don’t SQP purchases match Business Reports?
Search Query Performance is a search-funnel report, not a sales ledger. Trade sources describe a 24-hour attribution window on purchase metrics, and cancelled or returned orders can remain in the counts. Use it to compare brand versus category, not to tie out revenue.
What should I do if I convert better than the category but have a tiny purchase share?
That is the growth list. Those terms are where you have permission to buy visibility — ranking work and exact-match spend against a conversion advantage you already have. Do not scale the inverse: terms where you convert below the category.
The metric that decides your organic rank
If you out convert the category, you’ll climb organic and sell more at a lower TACoS