Post Updated: October 14, 2026
Key Takeaways
- ACoS (advertising cost of sales) is ad spend divided by ad-attributed sales, multiplied by 100, and measures how efficiently ads turn spend into the sales they are credited with.
- TACoS (total advertising cost of sales) is ad spend divided by total sales, organic included, multiplied by 100, and shows how much the whole business depends on advertising.
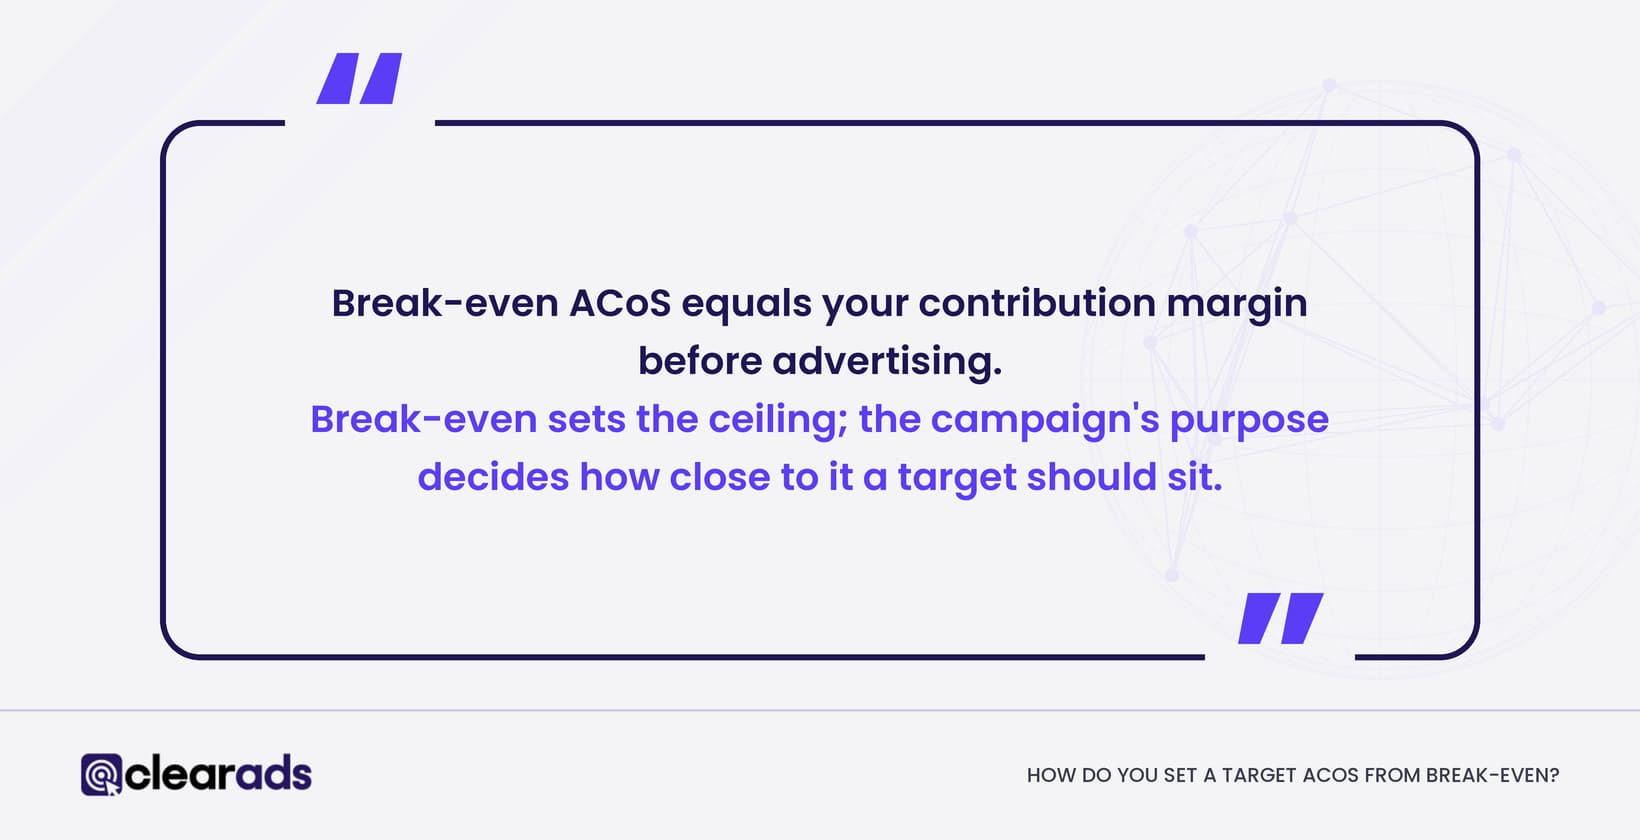
- Break-even ACoS equals your contribution margin before advertising, so a product with a 35% margin breaks even at roughly 35% ACoS.
- ACoS and TACoS read together tell a story that neither tells alone, such as efficient ads masking falling organic sales.
- Neither metric is profit, so targets should start from product economics and the campaign’s purpose, not from an industry average.
ACoS divides ad spend by the sales Amazon credits to your ads, while TACoS divides the same ad spend by all your Amazon sales, so ACoS judges campaign efficiency and TACoS judges how much the business relies on advertising. On this page, both metrics refer to Amazon Ads (Sponsored Products, Sponsored Brands and Sponsored Display), with total sales taken from Seller Central or Vendor Central. The distinction matters because a falling ACoS can come with a shrinking business, and only TACoS shows it. The sections below give each formula, show how to set a target ACoS from margin, explain how to read the two together, and cover how Clear Ads improves both without stalling growth.
What is ACoS, and how do you calculate it?
ACoS (advertising cost of sales) is ad spend divided by ad-attributed sales, multiplied by 100. Amazon reports ad spend as Cost, so in the console the formula reads Cost ÷ sales × 100.
ACoS = ad spend ÷ ad-attributed sales × 100
If $1,000 (USD) of ad spend produces $4,000 of attributed sales, ACoS is 25%.
Amazon defines ACoS as ad spend divided by ad revenue and says there is no single good number, because targets vary by business, industry and campaign goal. ACoS is the faster operational metric, because it can be calculated inside any advertising report at campaign, target, product or portfolio level.
ROAS: the same relationship turned around
ROAS (return on ad spend) = ad-attributed sales ÷ ad spend. ROAS is the inverse of ACoS, so a 25% ACoS equals a ROAS of 4, and a 20% ACoS equals a ROAS of 5. Use whichever your team reads more easily: ROAS suits revenue multiples, and ACoS compares directly with a margin percentage.
ACoS tells you what each dollar of attributed sales cost in advertising, and nothing about the sales the ads did not touch.
What is TACoS, and how is it different from ACoS?
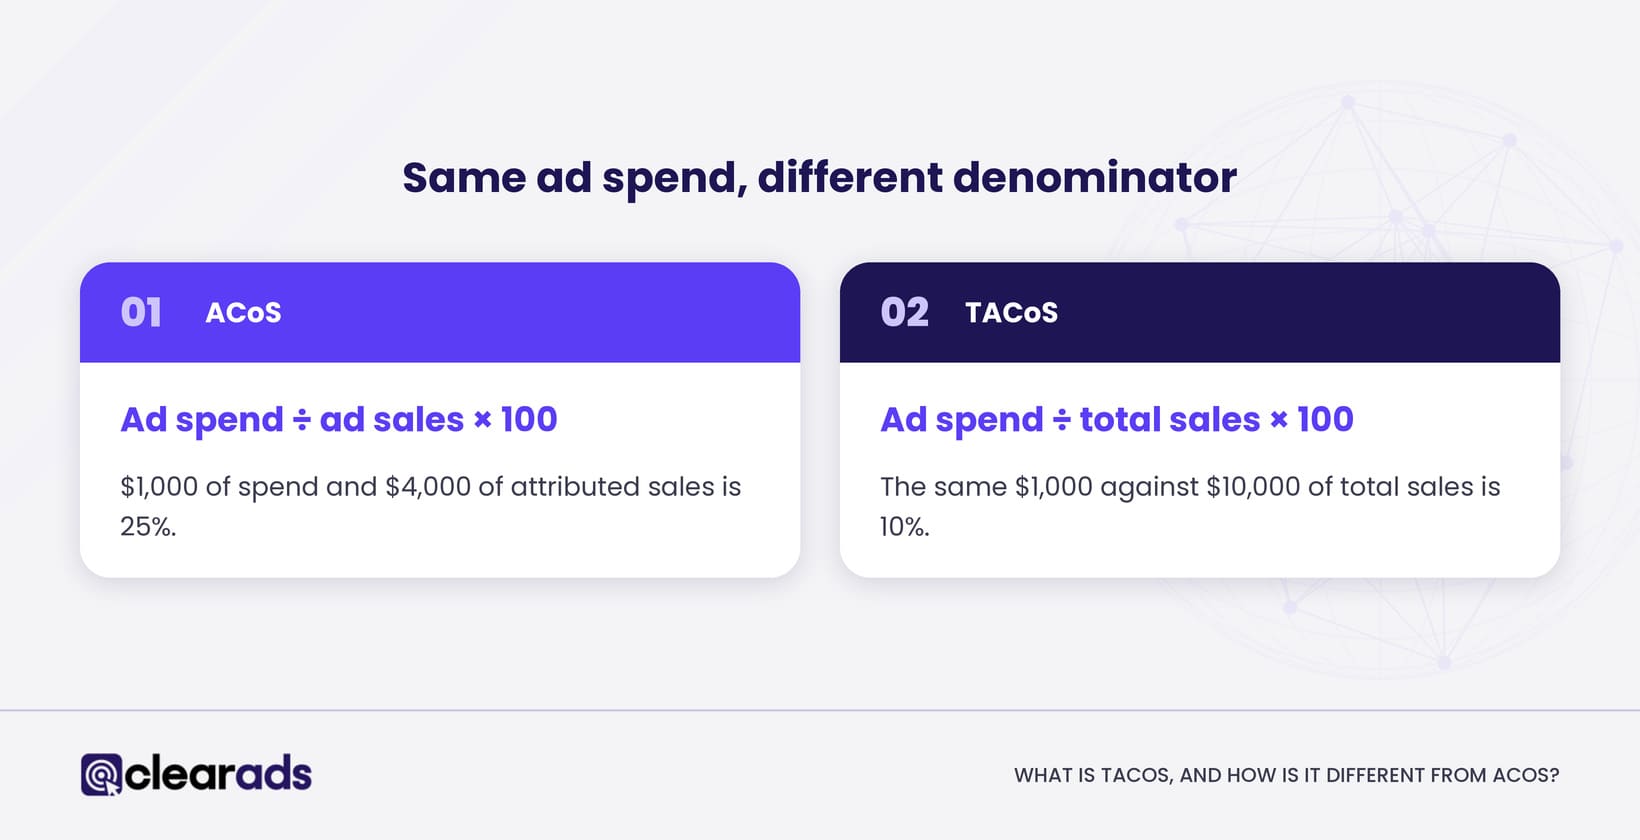
TACoS (total advertising cost of sales) is ad spend divided by total sales, paid and organic together, multiplied by 100. It uses the same ad spend as ACoS but a bigger denominator.
TACoS = ad spend ÷ total sales × 100
If the same $1,000 of ad spend sits against $10,000 of total sales, TACoS is 10%.
The denominator must be written down. Decide whether “total sales” means ordered product sales, shipped revenue or another Seller Central or Vendor Central field, and use the same source and tax treatment every period. A TACoS that changes source between months cannot be trended.
| Measure | ACoS | TACoS |
|---|---|---|
| Denominator | Ad-attributed sales | Total Amazon sales |
| Main use | Campaign efficiency | Whole-business context and organic growth |
| Best level | Campaign, target, product and portfolio | Product, brand, marketplace and account |
| Strength | Links ad spend to the sales it is credited with | Shows how much the business depends on ads |
| Limitation | Attribution is neither incrementality nor profit | Organic sales move for many reasons besides ads |
TACoS needs a retail sales source, so the team reporting it must line up timing, currency, marketplace and product scope between the ad report and the sales report.
How do you set a target ACoS from break-even?
Set a target ACoS by working out the product’s contribution margin before advertising, which gives the break-even ACoS, and then subtracting the profit you need to keep. The example uses teaching figures, not account data.
| Item | Amount (USD) |
|---|---|
| Selling price | 40.00 |
| Cost of goods | 12.00 |
| Amazon fees and fulfilment | 11.00 |
| Promotions, returns allowance and other variable costs | 3.00 |
| Contribution before advertising | 14.00 |
| Contribution margin before advertising | 35% |
Break-even ACoS here is about 35%. Spending $14 on ads to win a $40 sale uses up the whole contribution, and anything above 35% ACoS loses money on each ad-attributed sale.
A profit requirement lowers the target. If the business needs 10% contribution after advertising, the working target in this example falls to about 25% ACoS, on the same revenue and cost basis.
This is a planning model, not a figure Amazon provides. Include every material variable cost, use net revenue consistently, and revisit the target when price, fees or costs change.
Break-even sets the ceiling; the campaign’s purpose decides how close to it a target should sit.
What do ACoS and TACoS trends mean together?
Read together, the direction of ACoS and the direction of TACoS show whether ads are getting more efficient, whether the business is growing beyond them, or whether efficiency is hiding a problem. Clear Ads uses the combinations below as prompts for investigation.
| ACoS trend | TACoS trend | Likely story | What to investigate |
|---|---|---|---|
| Down | Down | Ads are more efficient and total sales are growing faster than ad spend | Confirm volume and margin are stable |
| Down | Up | Ads look efficient, but total sales are weakening | Organic sales, seasonality and attribution mix |
| Up | Down | Each attributed sale costs more, but total sales may be growing | Launch spend, halo sales and incremental lift |
| Up | Up | Ad spend is rising faster than attributed and total sales | CPC, conversion rate, price, stock and targeting |
| Flat | Down | Organic sales may be growing | Organic rank, branded demand and total sales quality |
| Flat | Up | The business relies more on ads, or organic demand is weaker | Organic rank, competition and listing issues |
These combinations prompt questions and prove nothing on their own. Price changes, promotions, stock-outs, returns, launches and seasonality can move both ratios at once.
When a high ACoS makes sense
A high ACoS can serve a clear goal:
- Launching a product and building its first traffic.
- Winning new-to-brand customers who are likely to buy again.
- Defending important branded search terms.
- Entering a new category or marketplace.
- Clearing stock when holding it would cost more.
- Testing a query, creative or audience before scaling it.
Each case still needs a spending ceiling, a time limit and a measure of success. “Growth” should not become a permanent excuse for unprofitable traffic.
When a low ACoS misleads
A very low ACoS can mean:
- The campaign mostly catches shoppers who were already going to buy the brand.
- Bids are so cautious that profitable volume is being missed.
- Only mature, high-converting products receive budget.
- Discovery and new-customer campaigns have been cut.
- Sales are falling faster than the ratio shows.
Amazon recommends new-to-brand metrics alongside ACoS for Sponsored Brands, because winning first-time customers usually costs more than repeat sales and cannot be judged on ACoS or ROAS alone.
How do you improve ACoS and TACoS without stalling growth?
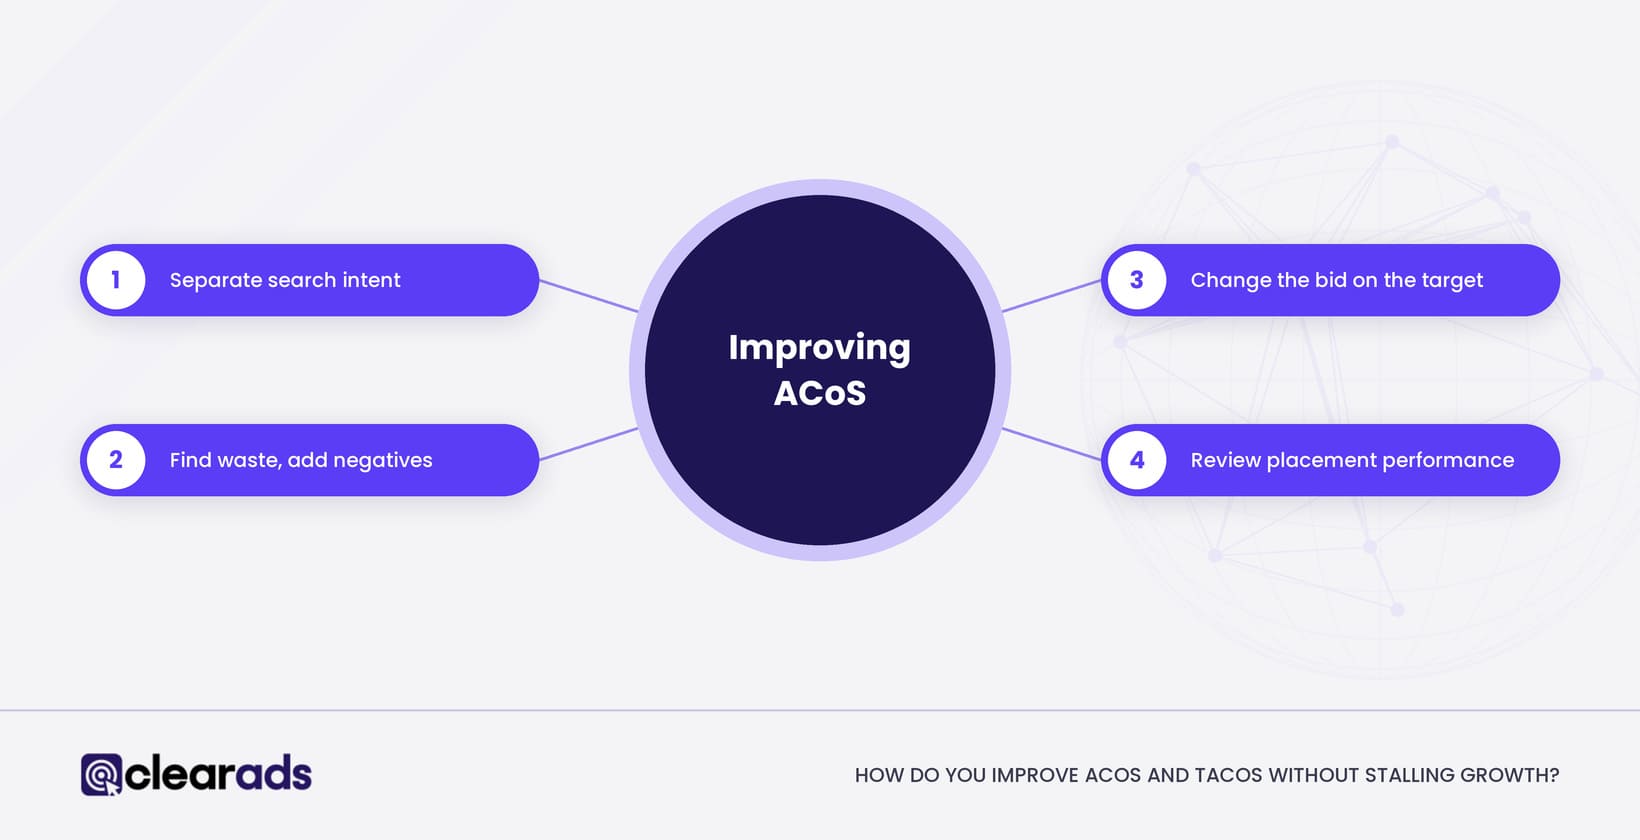
Improve ACoS by cutting waste and raising conversion rate, and improve TACoS by growing organic sales, while watching sales volume so that neither ratio improves just because the business shrank. Work through the steps below in order.
Improving ACoS
- Separate branded, generic and competitor search intent into their own campaigns.
- Find waste in the Search Term Report and add precise negatives.
- Change the bid on the target responsible, using the targeting report.
- Review placement performance before changing placement bid adjustments.
- Raise conversion rate through price, reviews, content, stock and delivery speed.
- Move budget towards products with enough margin and stock.
- Read promoted sales separately from halo sales when judging one product.
- Track sales volume and TACoS alongside every ACoS change.
The conversion rate side of step 5 is covered in the Amazon ads conversion rate guide.
Improving TACoS
TACoS falls when organic sales grow, when advertising gets more efficient, or when ad spend is cut. The first two are usually good news; the third can simply shrink the business. To lower TACoS while protecting growth:
- Prioritise search queries where conversion rate is strong but impression share is limited.
- Use the Amazon Search Query Performance report to find where your brand loses share across paid and organic search.
- Improve listings and stock readiness before buying more traffic.
- Build repeat demand and new-to-brand customers where the economics support it.
- Match budgets to inventory, so rank-building is not cut short by stock-outs.
- Measure TACoS by product, because an account average can hide weak products.
Benchmarks and a reporting template
An industry average is not a target. Published ACoS benchmarks vary widely by category, price point, account maturity and method, so start from the product’s contribution margin and the campaign’s purpose, which is also where Amazon’s own guidance starts.
A useful monthly product table holds:
| Field | Why it matters |
|---|---|
| Total sales | TACoS denominator |
| Ad-attributed sales | ACoS denominator |
| Ad spend | Numerator for both metrics |
| ACoS | Campaign efficiency |
| TACoS | Dependence on advertising |
| Contribution margin before advertising | Break-even guardrail |
| Purchases and units | Volume and basket size |
| CPC and conversion rate | Explain any ACoS movement |
| New-to-brand share | Customer acquisition context |
| Stock and Featured Offer status | Retail constraints |
Recalculate account totals from total ad spend and total sales. Averaging product-level ACoS or TACoS gives a low-volume product the same weight as a high-volume one.
Frequently asked questions
What is a good TACoS on Amazon?
There is no universal good TACoS. Compare it with the product’s own history, margin, lifecycle stage and total sales trend, because a new launch and a mature repeat-purchase product should not share a target.
Can TACoS be lower than ACoS?
Yes, and it usually is. TACoS divides the same ad spend by total sales, which include organic sales, so its denominator is normally larger than ACoS’s.
Should ACoS use gross or net sales?
Amazon’s reported ACoS uses its own attributed sales figure, which has tax taken off in marketplaces where prices include VAT or GST. For an internal profit view, use one consistent net revenue basis and reconcile tax, discounts, returns and fees separately.
Does TACoS include Amazon DSP spend?
It depends on how you define it, so state the definition in every report. Reporting Sponsored Ads TACoS and an all-advertising TACoS that includes DSP as separate lines keeps both views visible, because DSP often reaches shoppers who later buy through other routes.
Why is my ACoS different in the console and in my reporting tool?
The two may use different attribution windows, date ranges, currencies or sales fields, and recent days may not have matured. The causes, and how to line the figures up, are set out in why Amazon ads reports disagree.
What does this page not cover?
This page covers ACoS, TACoS and ROAS and how to set targets from them, and leaves four topics to other pages:
- The full set of PPC metrics and their formulas: Amazon PPC metrics.
- Calculating conversion rate step by step: the Amazon ads conversion rate guide.
- Optimisation techniques for running campaigns: Amazon PPC optimisation techniques.
- Setting budgets and bids: Amazon PPC budgeting and bidding strategies.
What is the next step?
Work out the break-even ACoS for your three biggest products, set a target for each from its margin and purpose, and add a TACoS line to your weekly report with its total sales source named. The Amazon PPC hub covers how campaigns, targeting and budgets fit around these targets.
If your ACoS looks healthy but total sales are not growing, or the reverse, Clear Ads Amazon PPC management sets ACoS and TACoS targets from product economics and manages campaigns against both every week.