This article starts with the definition and importance of placements in the Amazon Placement Report and covers the purpose and usage of the report. It then explains how advertisers can access and download the report, followed by a detailed breakdown of the key metrics found in it, including engagement, cost, conversion, and performance metrics. The article further explores how advertisers can use the report to optimise their campaigns, including bid adjustments and budget allocation strategies. Finally, it highlights key takeaways from the Amazon Placement Report, focusing on actionable insights, bidding strategies, and campaign optimisation techniques.
The Amazon Placement Report provides advertisers with insights into how Sponsored Products perform across different placements. This report enables advertisers to refine their bidding strategies by analysing key metrics such as impressions, clicks, and return on ad spend (ROAS). By accessing the report through the Amazon Ads console, advertisers can evaluate ad performance across Top of Search, Rest of Search, and Product Pages, adjusting bid multipliers accordingly. The article outlines best practices for optimising campaigns, common pitfalls to avoid, and real-world examples of successful bid adjustments to improve efficiency and profitability.
The Amazon Placement Report serves as a vital resource for advertisers aiming to maximise ad efficiency on Amazon. This article explains the significance of ad placements, the steps to access the report, and the key metrics advertisers should analyse. It provides actionable insights on adjusting bid multipliers, allocating budgets effectively, and optimising campaigns based on performance data. By leveraging the report, advertisers can refine their bidding strategies, improve ROAS, and enhance overall campaign profitability while avoiding common mistakes in bid adjustments.
Amazon has established itself as a dominant player in the digital advertising industry. In the third quarter of 2024, its advertising revenue reached $14.33 billion, reflecting a 19% year-over-year increase. Over the past twelve months, Amazon’s advertising segment has generated approximately $50 billion, underscoring the growing investment from businesses leveraging the platform to reach consumers.
This 19% growth rate makes Amazon the fastest-growing among major tech companies in the advertising sector, surpassing Meta (+18.7%), Google (+10.4%), and YouTube (+12.2%). The platform’s increasing ad revenue highlights the critical role of strategic ad placements in driving performance and return on investment for businesses.
As advertisers continue to refine their strategies, understanding ad placements is essential for maximizing visibility, optimizing costs, and improving conversion rates. This article explores the Amazon Placement Report, detailing how advertisers can use it to analyze campaign performance, adjust bid strategies, and enhance overall advertising efficiency.
What Are Placements in the Amazon Placement Report
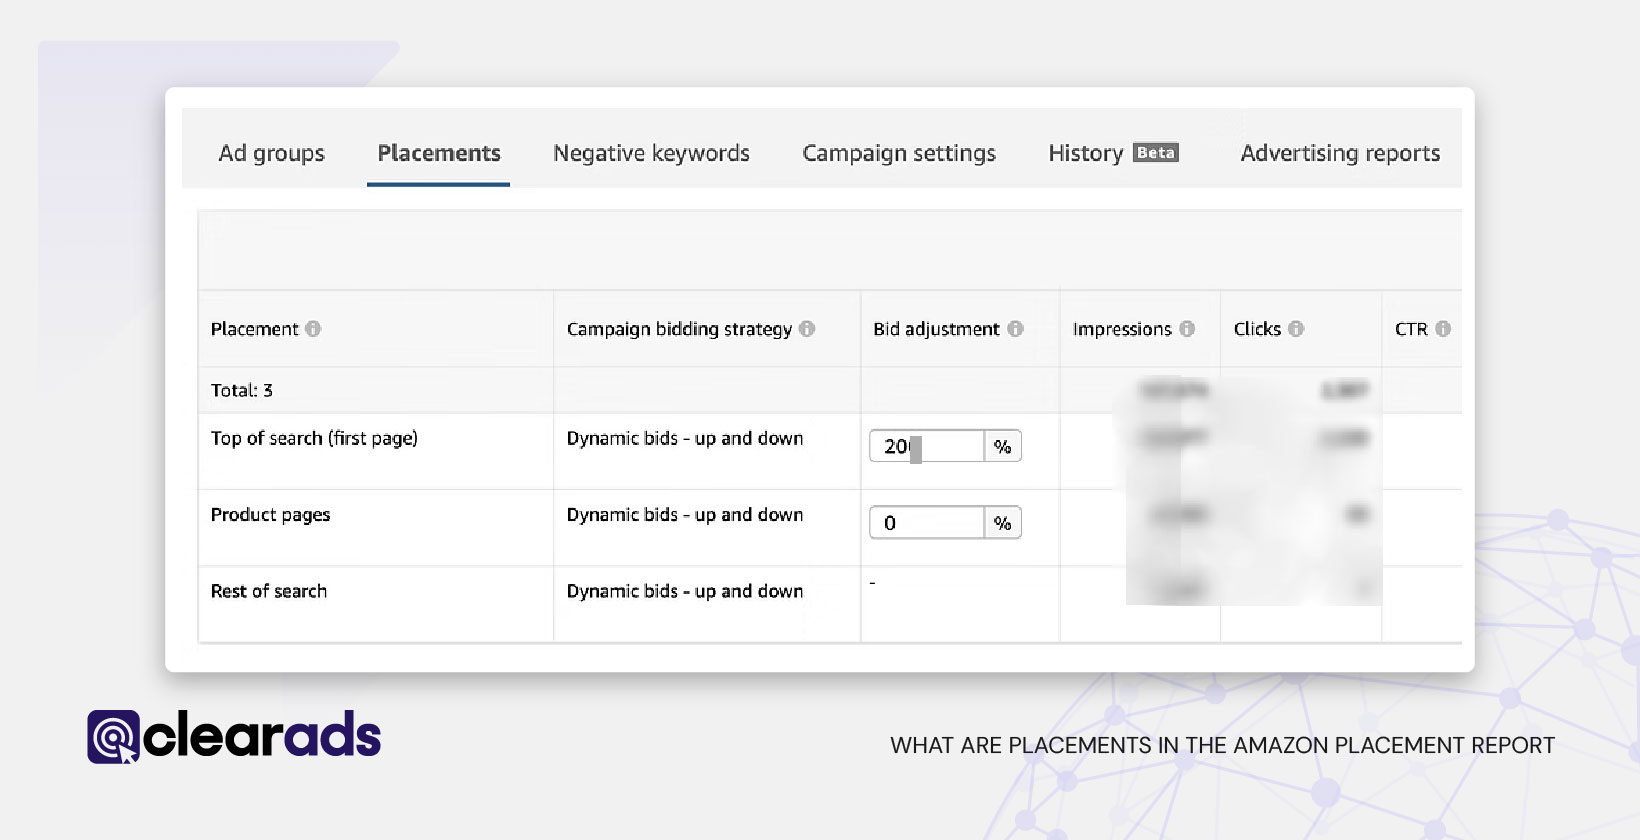
Placements in the Amazon Placement Report refer to the specific locations where Sponsored Products ads appear across Amazon. The report categorises these placements into four primary groups:
- Top of Search (First Page): Sponsored Products ads that appear in the top row of the first-page search results. These placements generally have higher visibility, click-through rates (CTR), and conversion rates (CVR).
- Rest of Search: Sponsored Products ads that appear in search results beyond the top row, including those on the second page and beyond. These placements usually receive lower traffic but can be more cost-effective.
- Product Pages: Sponsored Products ads displayed on product detail pages, the add-to-cart page, and other non-search placements. These ads target users browsing specific products, offering a different type of engagement.
- Amazon Business Placements (Beta): Sponsored Products placements that appear on Amazon Business. These include Amazon Business Top of Search, Amazon Business Product Pages, and Amazon Business Rest of Search, providing tailored visibility for business customers.
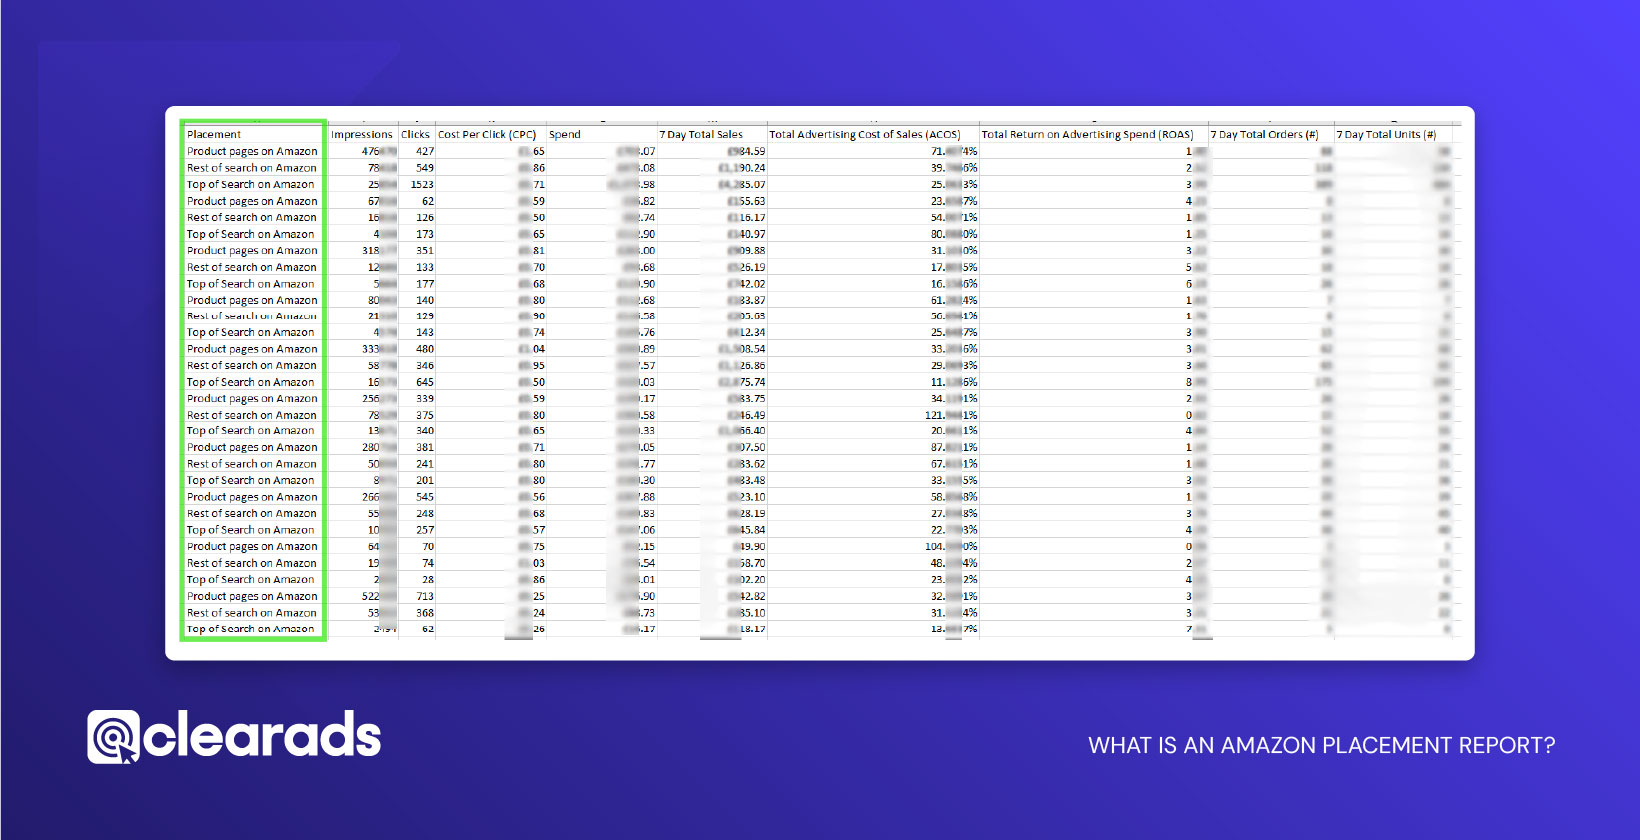
By analysing metrics such as 7 day total sales, impressions, clicks, cost-per-click (CPC), advertising cost of sales (ACoS), total sales, return on ad spend (ROAS), and total orders, advertisers can determine which placements are driving the best results. The Amazon Placement Report provides insights allowing advertisers to optimise bid strategies and maximise ad performance based on placement effectiveness.
What Is an Amazon Placement Report?
The Amazon Placement Report is a downloadable report that provides advertisers with insights into how their Sponsored Products campaigns perform across different ad placements. It helps identify which placements, Top of Search, Rest of Search, Product Pages, and Amazon Business Placements, generate the most engagement and conversions. By analysing this data, advertisers can make informed decisions about bid adjustments to maximise their return on investment (ROI).
How Does the Amazon Placement Report Differ from Other Amazon Reports?
Unlike broader campaign performance reports, the Placement Report specifically focuses on ad placement data. While reports such as the Search Term Report highlight keyword effectiveness and the Targeting Report provides insights into matched targets, the Placement Report is unique in breaking down performance based on where ads appear on Amazon. This allows advertisers to refine their bidding strategies by optimising spend across high-performing placements.
What are the Different Sponsored Advertising Types Where You Can Find the Amazon Placement Report?
- Log in to Amazon Seller Central
- Use your seller account credentials.
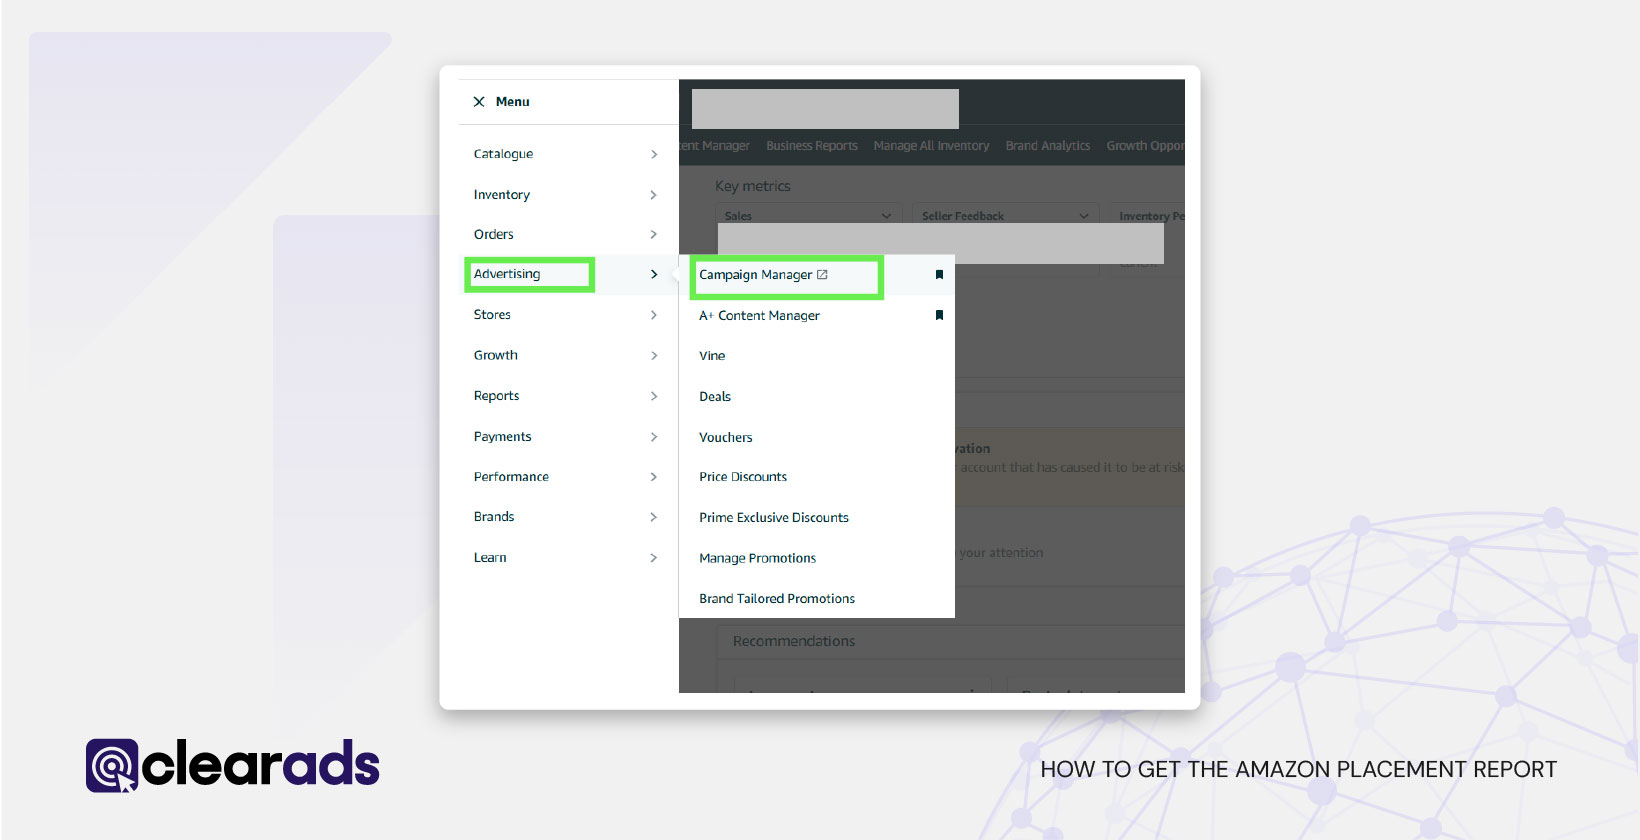
- Access the Advertising Section
- Click on Advertising in the main menu.
- Select Campaign Manager.
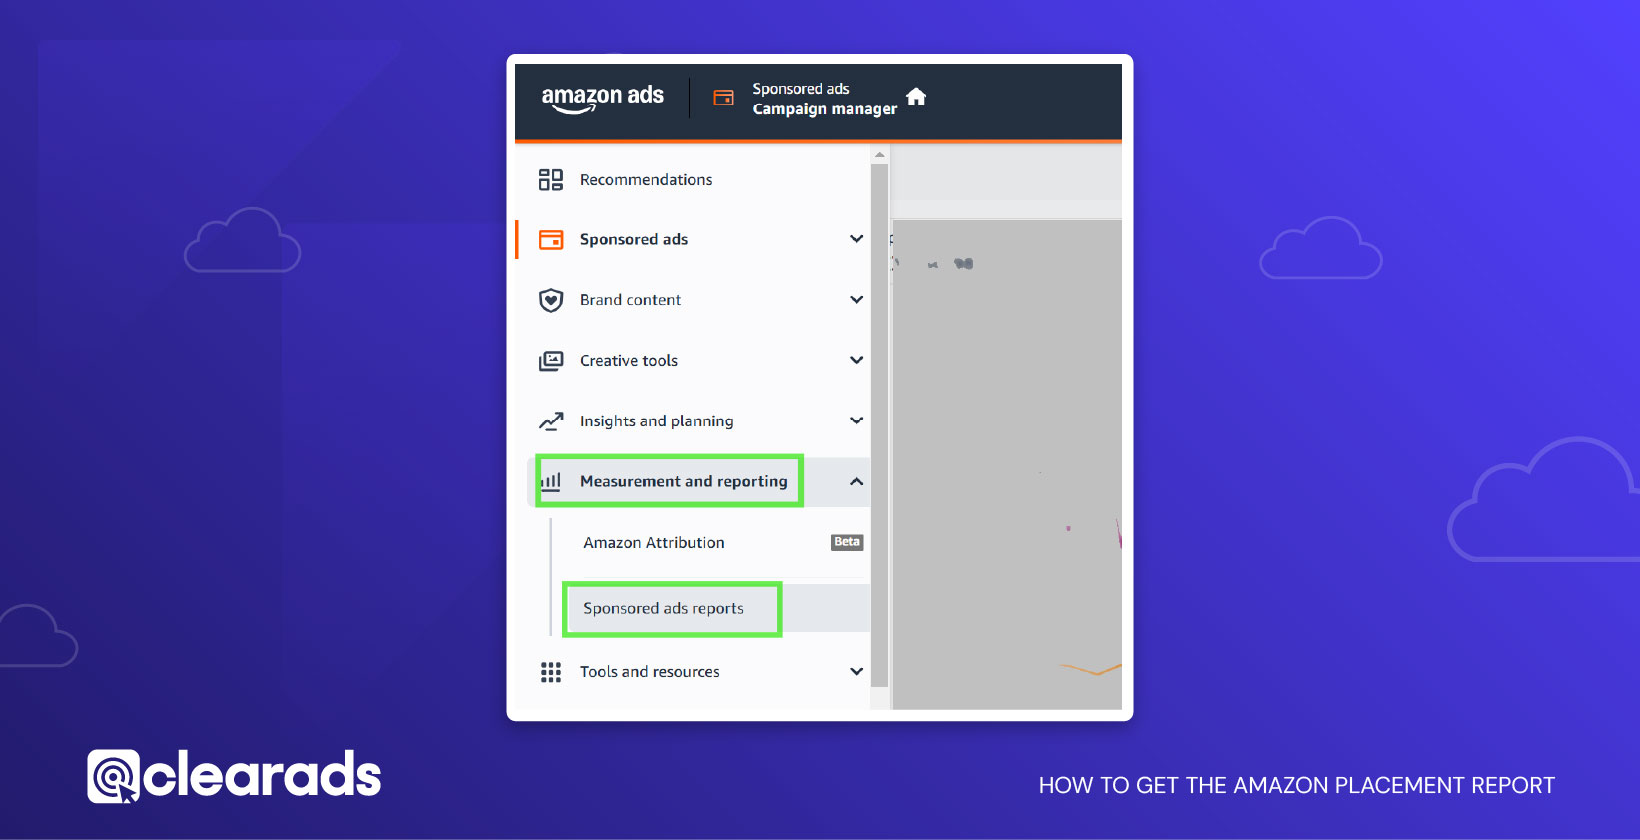
- Navigate to the Reports Section
- In Campaign Manager, click Measurement and Reporting.
- Select Sponsored Ads Report.
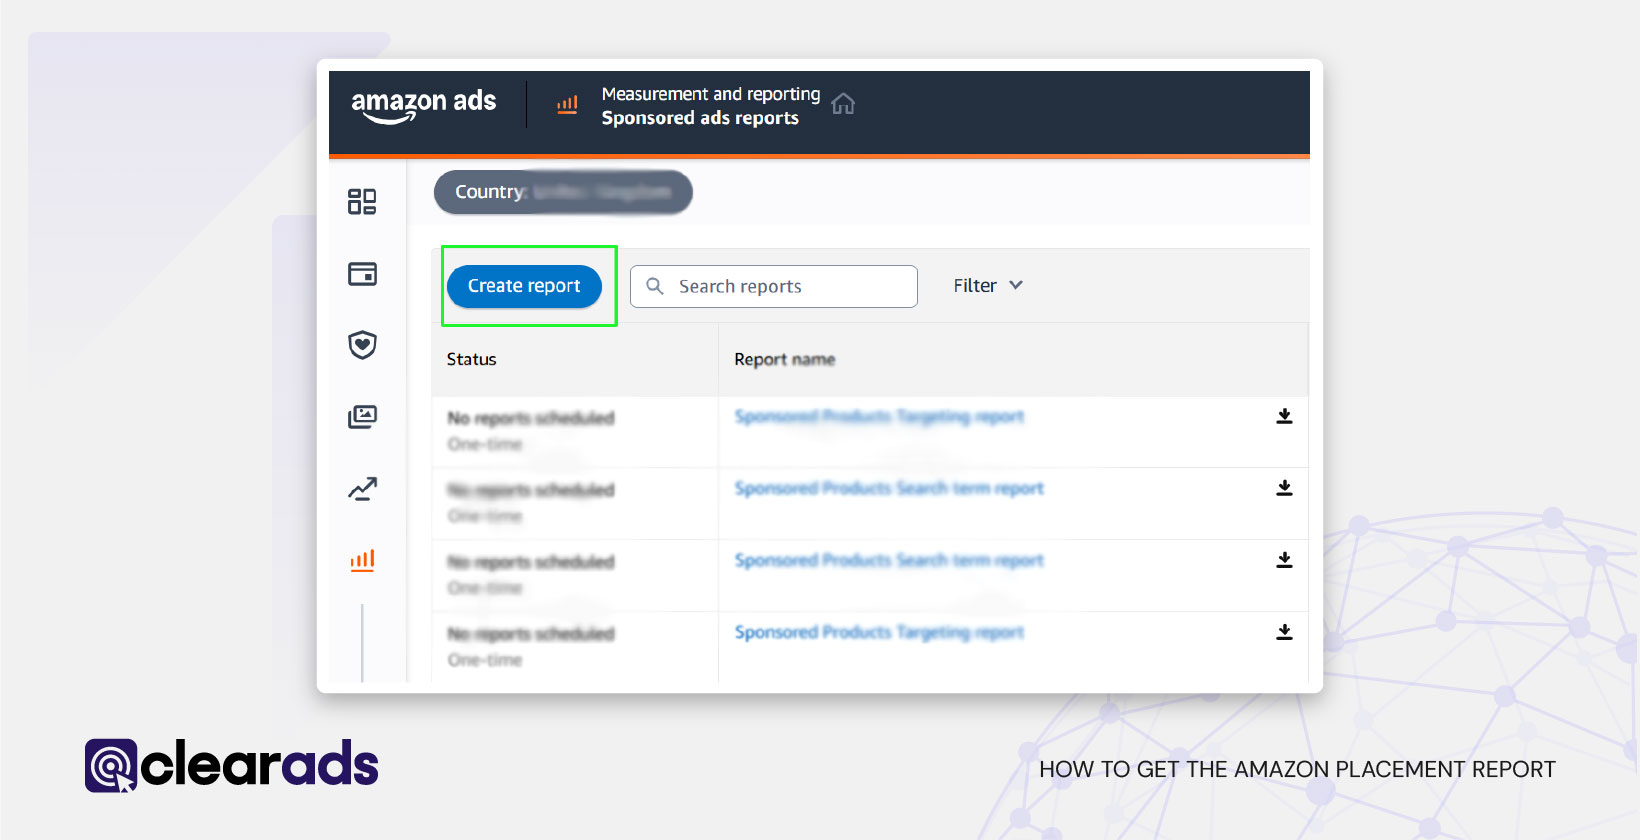
- Create a New Report
- Click on Create Report.
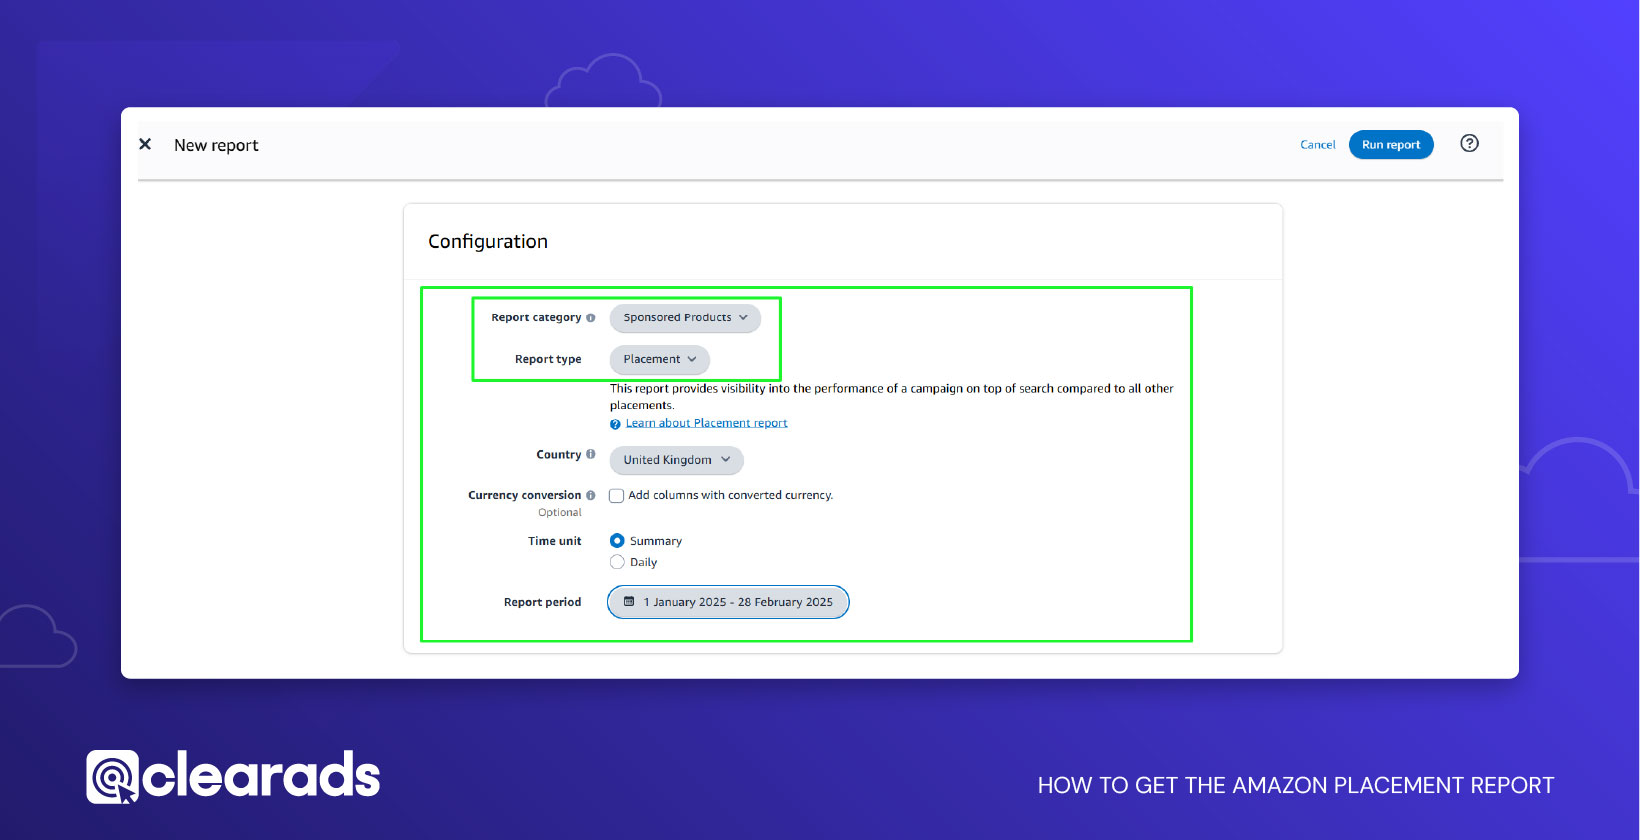
- Set the following parameters:
- Report Category: Choose Sponsored Products.
- Report Type: Select Placement Report.
- Time Unit: Choose Summary or Daily, depending on the analysis required.
- Report Period: Define the date range for the data.
- Configure Reporting Settings
- Enter a Report Name.
- Add email recipients to receive the report.
- Request Time: Choose from Now, Future, or Recurring as per the requirement.
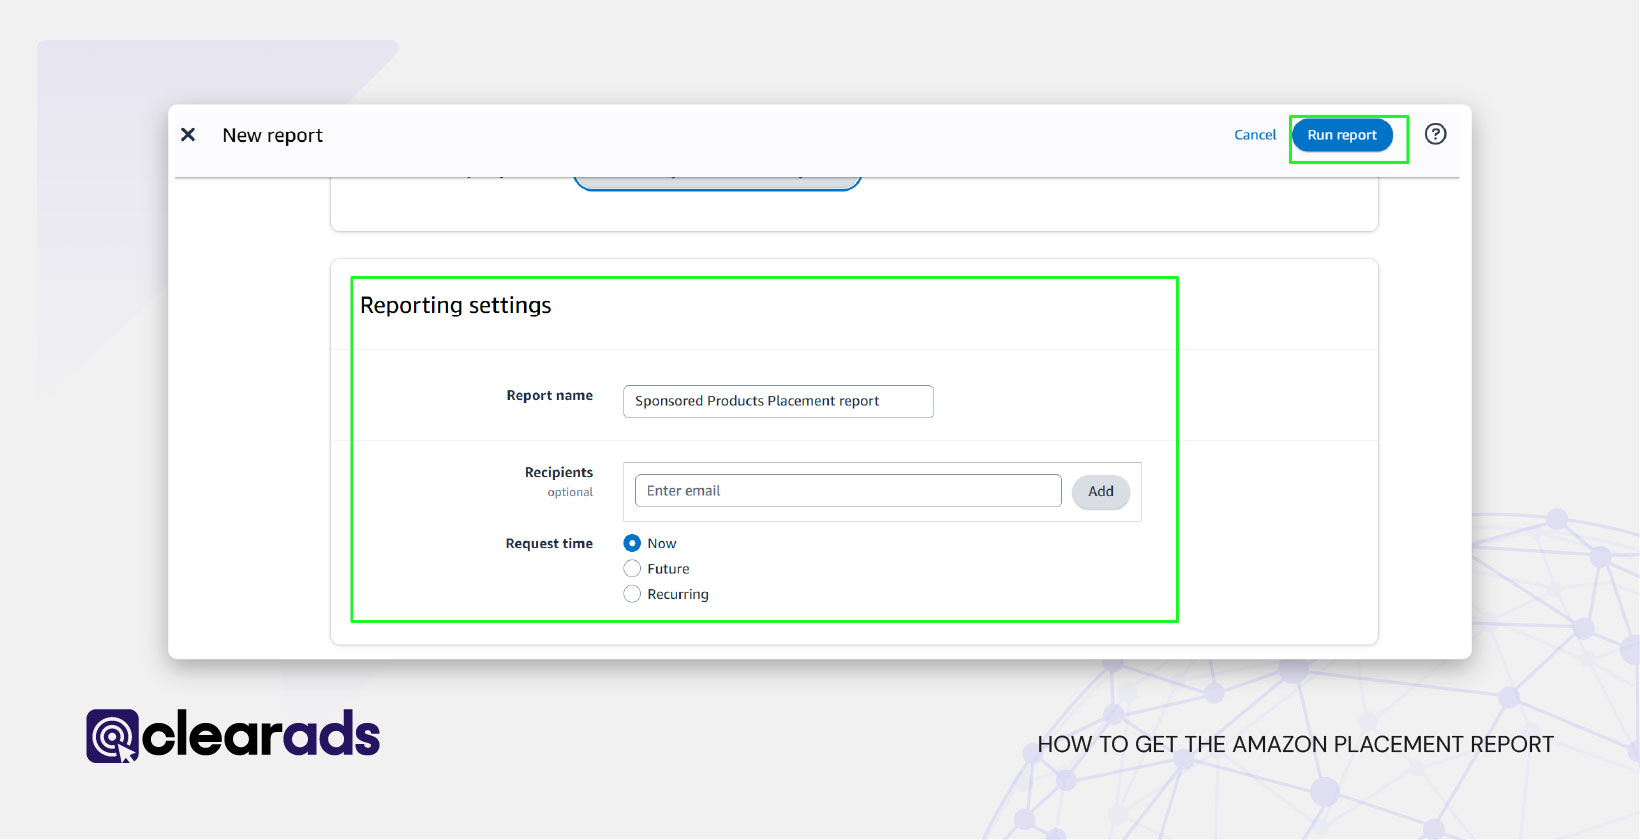
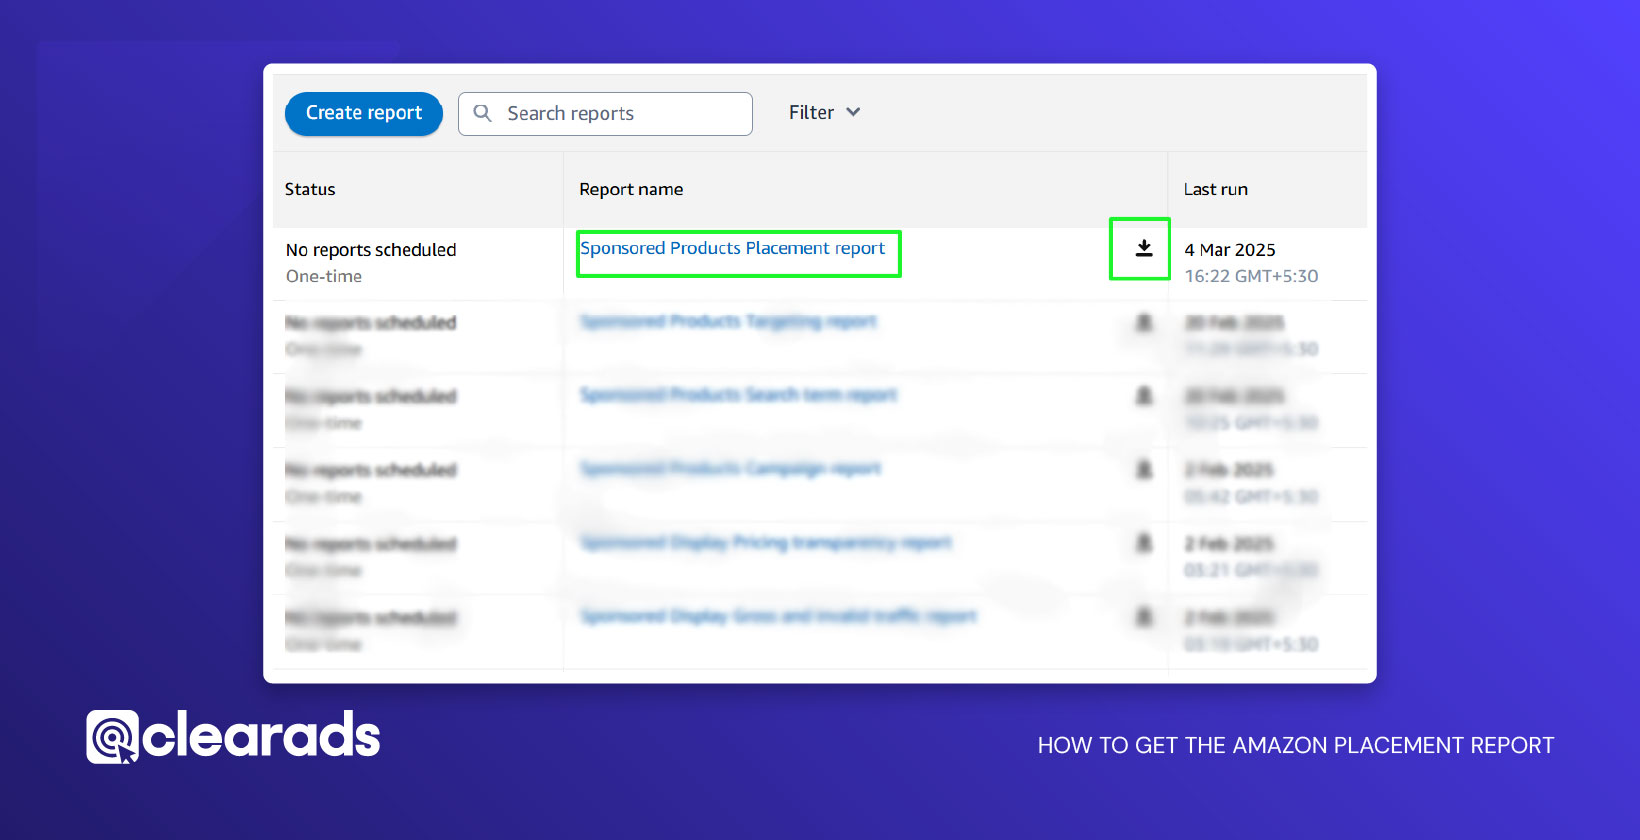
- Generate and Download the Report
- Click Run Report.
- Once ready, download the report in CSV format, which can be opened in Microsoft Excel or Google Sheets for detailed analysis.