An Amazon search query is the search term used to find a product and its overall effect on a campaign. Therefore, assessing a search query performance gives insight into shopping behavior.
Search queries have a slightly different definition from keywords. They can often be keywords in your campaigns, but not always.
Keywords are terms that are bid on by advertisers, whereas search queries are from the customer. One is information coming in, and the other is something going out. For example, search queries will give you the information, and keywords are implemented in it.
Search Query Performance Dashboard
You can access the search query performance dashboard through brand analytics in Seller Central. It allows sellers to monitor the performance of their product listings by identifying drop-off points and conversion issues.
Sellers can use the dashboard to optimize the underperforming campaigns for better search engine optimization through the underutilized search terms. The dashboard is the introduction to receiving first-party data of this kind!
The dashboard has two separate views:
- Brand View: This shows search query performance across all products within a selected period.
- ASIN View: This identifies the performance of top search queries for selected ASINs within a specific period.
The dashboard helps advertisers visualize how customers progress through the sales funnel. This information can significantly impact how you develop your campaign strategy.
If you are uncertain how to use the information to your advantage, ask your account manager for their expertise!
Eligibility
The dashboard is free to use if you are part of the Amazon brand registry. The brand registry is an Amazon version of a verification tick on Twitter. It legitimizes your brand for customers and protects your IP. However, it also gives you access to exclusive analytics, which will help you grow and track your progress!
Being a brand on Amazon protects the customer experience by reducing fraudulent seller activity and instills trust through their shopping journey. Notably, to be part of the brand registry, you require an active or pending trademark from a valid country. Check the requirements here.
Using the Search Query Performance Dashboard
Where Can You Find It?
Once you are in the brand registry, you can access the performance dashboard on seller central along with other unique analytics.
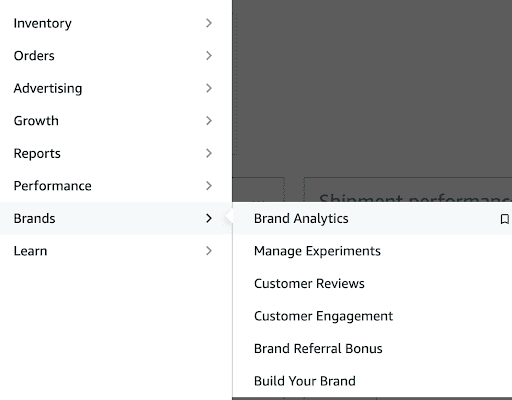
- First, open seller central.
- Then head towards the brand tab on the left side of the screen in the drop-down list.
- Next, hover over the brand tab to find brand analytics.
- Selecting this will take you to the search query performance dashboard.
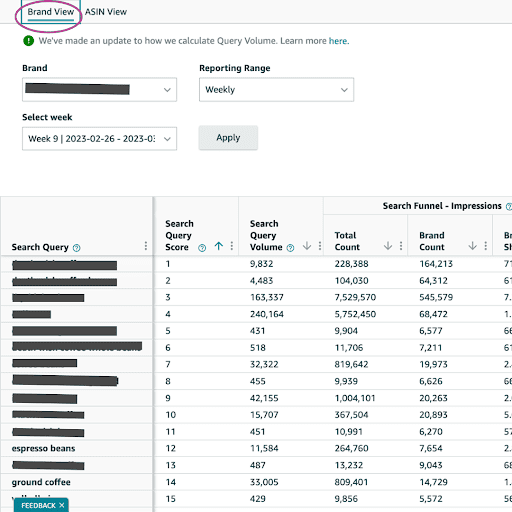
Reading The Dashboard
The first view of the dashboard can seem like an intimidating overflow of numbers. However, it is not much different from the other dashboards in Seller Central, and each column is self-explanatory.
- You will see at the top of the dashboard that you can switch between a brand view or an ASIN view depending on the goal of your research. On the same row, you will also have the option to customize the dashboard so you can see the relevant information. Doing this can make the dashboard easier to understand and save time.
- Down the left side will be the search queries used to search for your product. These will look different for each brand depending on what you sell. The terms are in descending order from 1- 1,000, but this can be reversed.
- By scrolling to the right, you will see the rest of the columns, which include: impressions, add to carts, clicks, and purchases.
All of the information can upgrade your campaign strategy by giving you a greater understanding of search behavior.
Valuable Available Metrics
The performance dashboard supplies sellers with invaluable audience insights to upgrade their campaigns. Once sellers understand how customers discover their products, they can fine-tune their marketing strategies to enhance their listings. The data can also spot market trends that may indicate new product opportunities.
Search Query Score
The search query score identifies the performance of a term from highest to lowest. It is placed immediately after the search query and cannot be hidden, like the other columns.
The score is an aggregated number taken from numerous metrics, shown in the metric glossary in the top right corner. Understanding how scores are processed will aid in understanding your campaign performance.
Search Query Volume
Another helpful metric on the dashboard is the search query volume. This number shows the number of times someone searched the term. It is beneficial as it gives you a genuine indication of your search term performance.
If a customer clicks on your product through a different product page, it will not be on the search term report. So you can see how effective an individual term is for conversions and know where your traffic is from.
Impressions
An impression is the number of results that appear in the search results after a query. The products you see on the results page would be considered ‘impressions.’
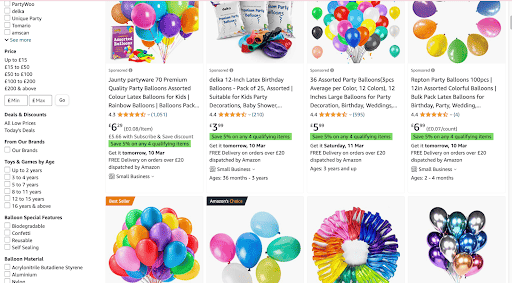
Impression can be helpful to track the market share of your brand for a particular term as it can indicate how likely a customer is to convert. For example, if a customer receives 100 impressions for balloons and you have 4 products on the search page, you have a market share of 4%.
See what search terms are giving the most impressions and view how likely those impressions will lead to a sale.
The impressions section of the dashboard can show you:
- Total, ASIN count, and brand count.
- ASIN and brand share of impressions.
- Delivery speed.
- Price.
Clicks
Viewing your click rate on the search performance dashboard can indicate your traffic. This column shows how many people interact with your product after a search.
Here is where you will see the most variability if your rank changes or you start using PPC advertising!
You will see similar metrics as the impressions column, but clicks will include a click rate. The click rate is the total number of clicks over the volume count within a period.
Another variable you can view is the pricing and delivery options, which will indicate what variable motivates your customers.
Cart Adds
Add to the cart is the next step in the sales process from a click. You will see that the search query performance dashboard gives you information across the customer journey so you can identify pain points throughout.
This column shows how many customers have clicked on your product through the search and then added it to their cart. Remember that this section is not limited to successful purchases.
This variable can be incredibly helpful in determining if you need to adjust your PDP. For example, if you have a much higher click rate than add-to-carts, it may be worth looking at what you can optimize in your campaign. Do you have enough high-quality images? Could you adjust your pricing to align with competitors?
Purchases
Amazon distinguishes purchases from add-to-carts. This distinction is how you can tell how many customers complete the conversion.
Purchase rate can tell you a lot about your exposure. For example, a higher purchase than other metrics signifies that you are highly relevant in your product field but with limited reach. You can use this information to develop your campaign strategy!

Data Timeframes
Depending on what metric you are researching, you have a time frame of up to seven months!
The time frame or reporting range is one of the first options on the dashboard. To assess the historical data, it may be worth viewing the information quarterly to get a longer time frame.
On the other hand, a shorter time frame can show sellers’ recent trends. If you have just adjusted new campaigns or are expecting a seasonal product to take a hit, a shorter time frame will let you see recent fluctuations in search queries.
Advantages of Using SQP
Before Amazon’s Search Query Performance Dashboard, you could only receive data from the ad platform or use a third-party tool, but the SQP gives you access to both paid and organic search data.
Identify Top Keywords
The SQP dashboard’s main job is to identify the top-performing search terms for your brand, and it does it brilliantly. Understanding your audience is crucial for optimizing your business on Amazon. A seller cannot push their brand to its limits without feeding into what interests and converts their customers.
By identifying your top-performing search queries, you can incorporate these into your campaign strategy to produce the best results.
Funnel Optimisation
As I said previously, for any success in a customer-dependent business, you must understand your audience. Know which terms convert the most, and understand where there is potential.
You can use your account manager to assess the information in the SQP to recognize the shopping progression of your customers. For example, are you receiving a much higher click rate than purchases? Find the gaps along the consumer journey and see more completed search queries.

You want customers to search for ‘balloons’ and follow your brand from impression to purchase.
Share of Voice
Another benefit of using the SQP is the capacity to visualize the brand share for each search term. Knowing your brand share will help you understand where you stand compared to your competitors and is a good indicator of rank changes.
Sellers can also use third-party tools to help track the position of keywords on the search results page.
Competitor Search Terms
Through the ASIN type view, you can find the top 10 competitors for a particular search term. You can see their impressions, clicks, median price, click share, and impression share.
Naturally, this can have a massive impact on your campaign strategy as you can adjust and compare to keep up with their prices and steal their terms.
Exporting Data From SQP
How do you get the search query performance data into a spreadsheet?
The most significant negative about the dashboard is that you cannot directly export its data. You could do the arduous task of copying and pasting the information into a google sheet, but this is far from a satisfactory conclusion.
You can export and analyze the data by downloading the search query performance analyzer! To streamline the process, use an HTML scraper to copy and paste the data into the template linked to view the data.
How Do I Export Search Query Performance Dashboard Data? [The PPC Den Podcast]
Identifying Keyword Cannibalization
You may have heard about keyword cannibalization in association with marketing. It refers to when you use the same keyword too often throughout website content, which confuses search engines. Overusing terms causes search engines to confuse themselves and not discern what to rank higher, which can lower the rank of all the pages.
Despite the origins of keyword cannibalization, it is becoming increasingly relevant for optimizing Amazon campaigns. It refers to when a seller is bidding on the same keyword for multiple products, which can cause them to compete against each other and reduce overall sales for each product.
The SQP dashboard can help prevent this by identifying the successful terms for each product. Through assessing similar queries you can adjust your strategy to reach a broader audience and increase product visibility. Without competing with yourself for keywords, you will increase the rank of the individual products and improve your sales.
For more information on how to prevent cannibalization of your keywords why not listen to our recent podcast on the topic.

Getting Started
With over a decade of experience in digital advertising, we at Clear Ads have become a sought-after agency for Amazon advertising. We have helped hundreds of businesses achieve their potential because we are confident in what we do.
Our account managers are skilled in the tools needed to optimize your campaigns for the best results. Through the help of one of us, you can save time on analyzing data and focus on what matters most to you, your business.
We are proud that all our account managers stay up-to-date with their Amazon certifications. As Amazon partners, we consistently stay informed on industry changes and Amazon updates. You can rest easy knowing that we are qualified Amazon advertisers.
To discover more about how we can help your business grow and take advantage of your brand benefits, request a callback today!