Key Takeaways
- The Amazon Search Query Performance (SQP) report shows, for each search query linked to your brand, how much of the search funnel your products capture, from impressions to purchases.
- SQP sits in Brand Analytics in Seller Central and is open to Brand Registry brand owners whose users hold the Brand Analytics permission.
- SQP combines organic results and Sponsored Products ads from the search results page, so it cannot split paid activity from organic activity.
- The first funnel stage where your share drops, whether visibility, clicks, cart adds or purchases, tells you which fix to test first.
- SQP and the Search Term Report answer different questions, so read them side by side and do not expect their numbers to match.
The Amazon Search Query Performance (SQP) report shows how much of Amazon’s search funnel your brand captures for the queries most linked to your products, from search volume through impressions, clicks and cart adds to purchases. Here SQP means the Brand Analytics dashboard in Seller Central, not a report in the Amazon Ads console. The distinction matters because SQP covers paid and organic search together, which no advertising report does, so it shows where shoppers drift away before any bid is changed. This page explains where to find SQP, how to read its columns, how Clear Ads uses it to find the weakest stage of the funnel, and how to combine it with your ad reports.
What is the Search Query Performance report?
The Search Query Performance report is a Brand Analytics dashboard that follows each search query through five stages, from search volume to purchases, and shows your brand’s share at each stage. Brand Analytics is the set of reports Amazon gives registered brand owners in Seller Central, and SQP is the one built around individual search queries.
The report has two views. In Brand view, each row is one search query linked to your brand’s catalogue. In ASIN view, each row connects one query with one of your products, which makes it the view to use when a single product is falling behind.
For every query, SQP tracks five stages of the shopper journey:
- Search query volume: how often shoppers searched the query.
- Impressions: how often products appeared in the results.
- Clicks: how often shoppers clicked a product.
- Cart adds: how often a product went into the basket.
- Purchases: how often a product was bought.
Each stage shows a total across all products, plus a count and a share for your brand or ASIN. Amazon says the report can show up to 1,000 queries, with the number depending on the size of your catalogue, and that the queries are chosen by how they perform in search results.
The scope decides how you read the numbers. Amazon says SQP covers organic results and Sponsored Products ads shown on the search results page, and leaves out traffic from search page widgets such as “Top Rated” and “New Arrivals”. Paid and organic activity are combined in every column, so SQP cannot show how much of your share came from ads.
SQP measures share of search, which makes it the one Amazon report that shows how your brand performs against every other product on a query.
How is SQP different from other Brand Analytics reports?
Each Brand Analytics report answers a different question, and SQP is the only one that follows a query through the whole funnel.
| Report | Question it answers | How SQP differs |
|---|---|---|
| Amazon Search Terms | Which searches are most popular, and which products win the most clicks and conversions for them? | SQP follows the full funnel for queries linked to your brand; Search Terms ranks popular searches and the leading products |
| Search Catalog Performance | How does each of your products perform across all search queries? | Search Catalog Performance starts with the product; SQP starts with the query |
| Market Basket Analysis | Which products are bought together? | Market Basket supports bundles and cross-selling, not search diagnosis |
| Repeat Purchase Behavior | Which products and customers bring repeat orders? | Repeat Purchase measures retention, while SQP measures how search wins new orders |
| Demographics | Who buys the brand? | Demographics describes customer groups rather than search behaviour |
Who can access SQP, and where do you find it?
SQP is open to sellers who hold the Brand Representative role for a brand enrolled in Amazon Brand Registry. Amazon describes the Brand Representative as someone internal to the brand who is responsible for selling it in the Amazon store, and the account’s primary administrator may also need to grant the user the Amazon Brand Analytics permission.
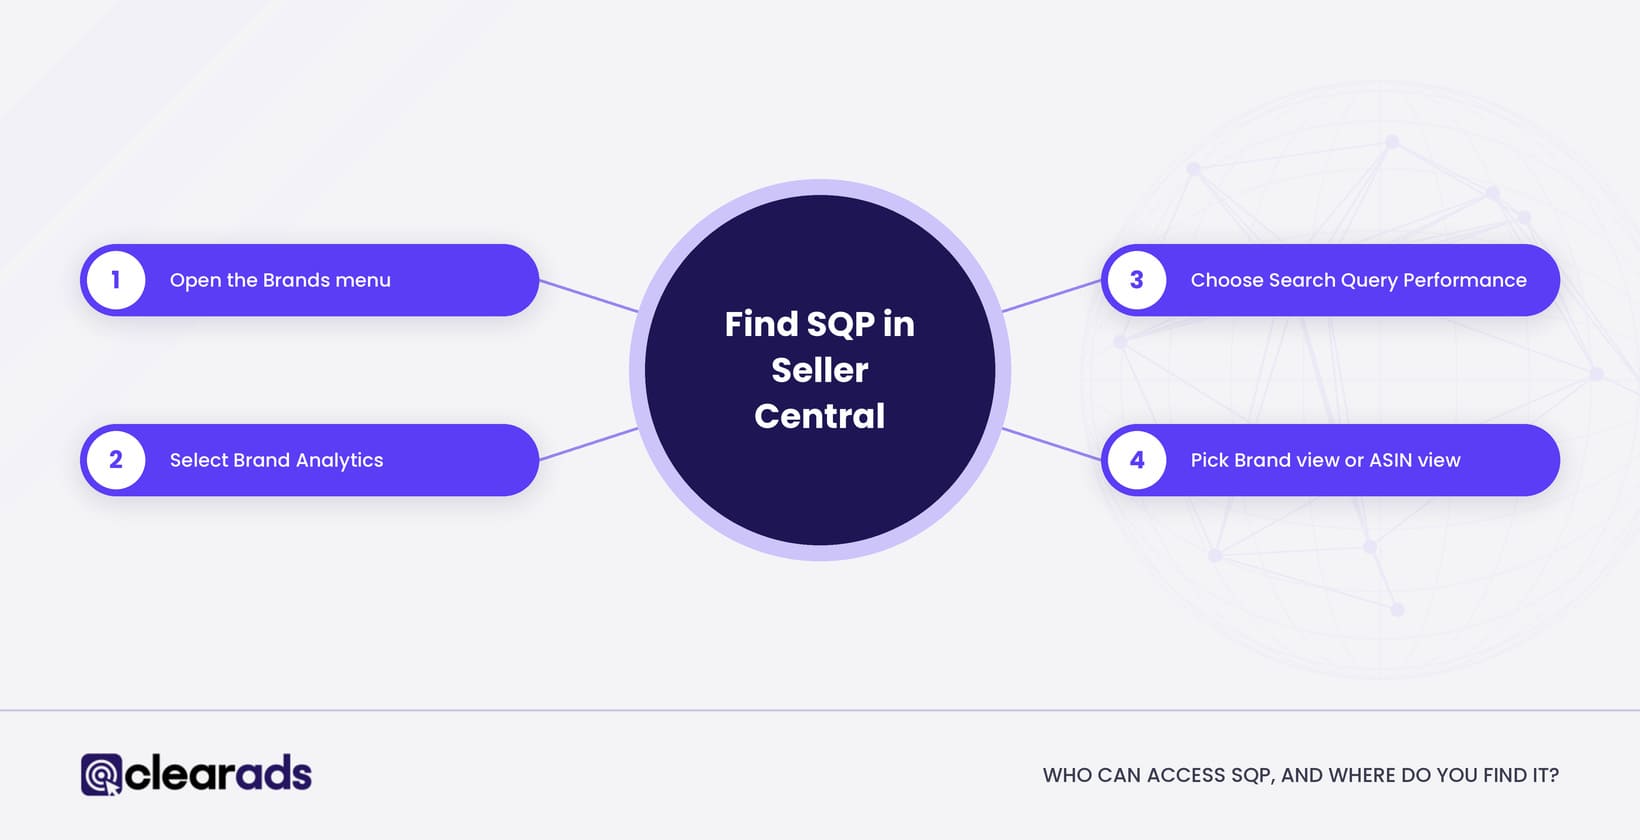
To open the dashboard in Seller Central:
- Open the Brands menu.
- Select Brand Analytics.
- Choose Search Query Performance.
- Pick Brand view or ASIN view.
- Choose a reporting period: a week, a month or a quarter.
Amazon says Brand Analytics data is generally available within 72 hours after the selected period closes. A reporting week runs from Sunday to Saturday, so the latest full week usually appears within three days of the Saturday it ends on.
Vendors should confirm access inside their own Vendor Central account rather than assume it, because Amazon’s API version of the report is documented for sellers only.
Access comes from Brand Registry and the Brand Analytics permission, so an Amazon Ads console login on its own does not open SQP.
Exporting SQP and pulling it through the API
You can download SQP from Seller Central or request it through the Selling Partner API. Amazon has described several download formats in Seller Central, including a simple view, a comprehensive view, an Amazon’s Choice badge download and a search funnel outlier download, although the options can vary by reporting range.
Through the Selling Partner API, the report type is GET_BRAND_ANALYTICS_SEARCH_QUERY_PERFORMANCE_REPORT. Amazon’s developer documentation lists it for sellers registered in Brand Registry who hold the Brand Analytics API role. The report returns JSON, covers one week, month or quarter, needs a list of ASINs, and has to be requested each time rather than scheduled. A request cannot span more than one period, so a weekly request runs from a Sunday to a Saturday.
The API suits teams that want SQP inside their own dashboards. Clear Ads covered the launch of API access to SQP reports when Amazon announced it.
How do you read the SQP columns?
Read each SQP row from left to right as a funnel, comparing your share at each stage with your share at the stage before. The table covers the core fields. Exports also carry price and delivery-speed fields, such as median click, cart-add and purchase prices split by same-day, one-day and two-day shipping.
| Field | What it shows | Question to ask |
|---|---|---|
| Search Query Score | Amazon’s ordering of the queries linked to your brand or ASIN | Is this query worth prioritising? |
| Search Query Volume | How often shoppers searched the query in the period | Is there enough demand to matter? |
| Total impressions | How often any product appeared for the query | How big is the visible opportunity? |
| Brand or ASIN impression count and share | Your part of those impressions | Do your products appear often enough? |
| Total clicks | All clicks from the query | Does the query attract real engagement? |
| Brand or ASIN click count and share | Your part of those clicks | Do shoppers choose you when they see you? |
| Total cart adds | Products added to baskets after the query | Does the query show buying intent? |
| Brand or ASIN cart-add count and share | Your part of those cart adds | Does your detail page build enough confidence? |
| Total purchases | Purchases that followed the query | Does the query produce sales? |
| Brand or ASIN purchase count and share | Your part of those purchases | Does your offer close the sale? |
Amazon counts an impression when a product is shown on the search results page. Because SQP measures search only, Amazon warns that its figures will not match advertising dashboards, which use different definitions and attribution rules.
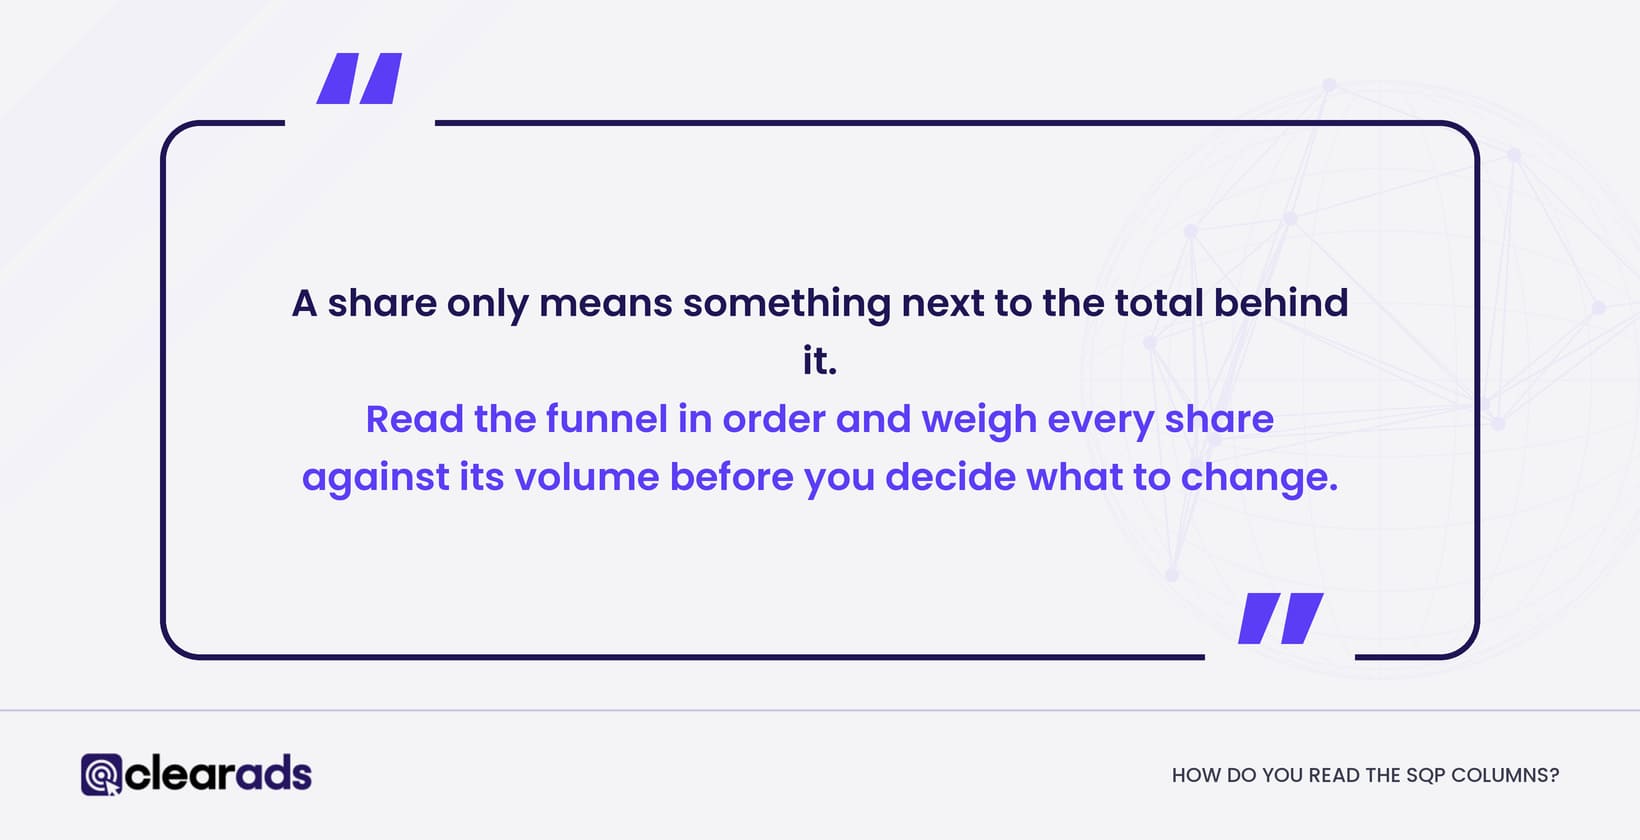
A share only means something next to the total behind it. A 40% click share on a query with 30 clicks says less than a 10% click share on a query with 3,000 clicks.
Read the funnel in order and weigh every share against its volume before you decide what to change.
What SQP cannot tell you
SQP diagnoses where to look, and five limits decide how far you can take it:
- It does not split organic activity from sponsored activity.
- It does not cover every way shoppers find products, only the search results page.
- It is not an advertising attribution report, so its purchases are not ad-attributed purchases.
- Fields with familiar names, such as impressions and clicks, follow different rules from the same names in Campaign Manager.
- A share shows where shoppers drop away, not why they did.
Confirm the likely cause in Campaign Manager, on the detail page and in competitor results before changing bids or listings.
Where does your brand lose share in the search funnel?
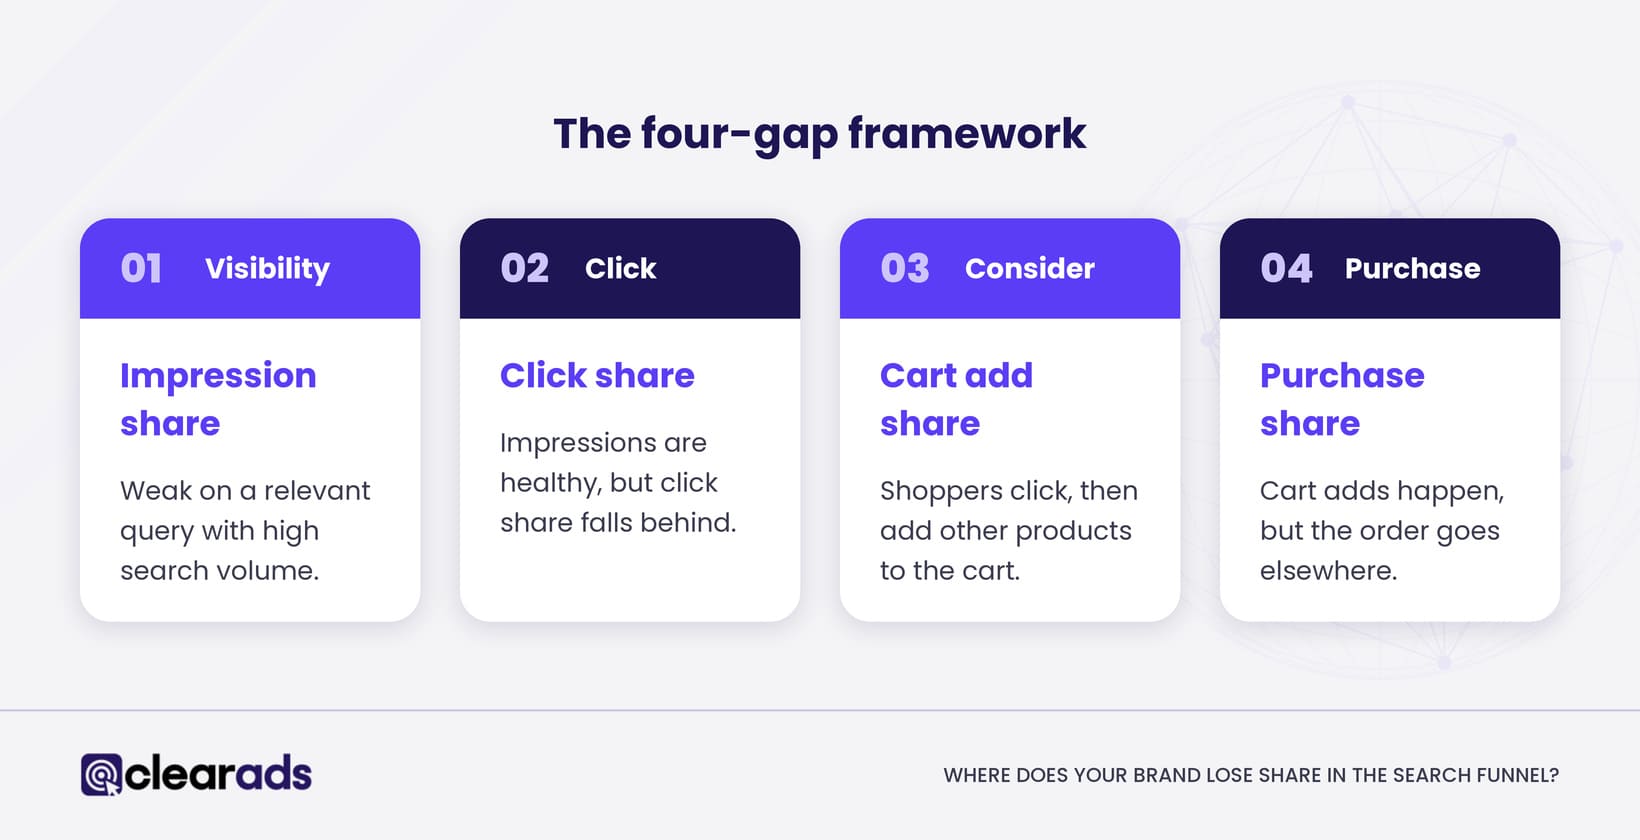
Your brand loses share at the first stage where its share falls below the share at the stage before, and that stage tells you which fix to test first. The Clear Ads four-gap framework below reads each priority query this way, because a bid change only fixes one of the four gaps.
Visibility gap
Signal: impression share is weak on a relevant query with high search volume.
The products are not appearing often enough. Likely causes are weak organic rank, too little ad coverage, campaigns that are not eligible to serve, stock problems or a listing that is not retail-ready. Check indexing, relevance, budget, bids and placement before rewriting the product page.
Click gap
Signal: impression share is healthy, but click share falls behind it.
Shoppers see the product and choose another result. Review the main image, title, price, star rating, review count, badges, delivery promise and how well the product matches what the query asks for.
Consideration gap
Signal: click share holds up, but cart-add share drops.
The search result earned the visit, and the detail page did not build enough confidence. Check secondary images, video, bullet points, A+ Content, variations, product claims, price and how competitors present the same need.
Purchase gap
Signal: cart-add share is healthy, but purchase share falls.
Something late in the journey stops the sale. Investigate delivery timing, stock, coupon visibility, price changes, Featured Offer ownership, variation availability and differences between offers.
A share that rises as the funnel narrows is usually good news. The brand may not get the most visibility, but the shoppers who do engage are more likely than average to buy, which makes the query a strong candidate for more coverage.
How do you combine SQP with the Search Term Report?
Combine them by matching SQP queries with the customer search terms in your Sponsored Products Search Term Report for the same weeks, then comparing ad cost and ad sales with your share at each funnel stage. SQP shows where the brand wins or loses across paid and organic search, and the Amazon Search Term Report shows which paid search terms produced clicks and sales.
- Pick a completed SQP week or month.
- Export Brand view and list the queries with the largest opportunity.
- Open ASIN view for the products that should compete on those queries.
- Export the Sponsored Products Search Term Report for the same dates.
- Match query text carefully, allowing for plurals, punctuation and spelling variants.
- Set ad cost, clicks, purchases and ACoS beside the SQP impression, click, cart-add and purchase shares.
- Give each priority query one main action, using the four-gap framework.
The figures will not line up exactly. SQP covers the search results page only and mixes organic with Sponsored Products activity, while ad reports date a purchase to the day of the ad click and keep adding purchases until the attribution window closes. The rules behind those differences are set out in why Amazon ads reports disagree.
The difference between a search term and the target that caught it is explained in Search Term Report vs targeting report. When SQP shows a query that deserves more paid coverage, the guide to Amazon PPC keyword research and management covers how to target it.
Worked example
The figures below are teaching figures, not account data.
| Query | Impression share | Click share | Cart-add share | Purchase share | First gap | First test |
|---|---|---|---|---|---|---|
| Query A (high volume) | 12% | 5% | 4% | 4% | Click | Main image, title, price, rating and query fit |
| Query B (high volume) | 4% | 7% | 9% | 10% | Visibility | More ad coverage and organic work on the query |
On query A, the biggest loss comes between impression and click, so higher bids would buy more of a result shoppers already pass over. The first test is the search result itself. On query B, the product converts well once shoppers find it, so the case for more ad coverage is strong.
SQP finds the query and the stage; the Search Term Report shows what your ads are already buying on that query.
Frequently asked questions
Is the Search Query Performance report free?
Yes. SQP is part of Brand Analytics, which comes with Amazon Brand Registry at no extra cost, and there is no separate subscription for it.
Can an agency see a brand’s SQP data?
Only through a user the brand authorises. Amazon’s eligibility wording describes the Brand Representative as internal to the brand, so the brand should grant the Brand Analytics permission to the right users rather than assume that access to the advertising console includes SQP.
Why does a brand-share field show a dash instead of a number?
A dash means the value is unavailable, for example because Amazon did not capture data for that period or the metric is new. Treat a dash as missing data rather than zero, and leave it out of any averages.
What is Search Query Score?
Search Query Score is Amazon’s ordering of the queries linked to your brand or ASIN in the selected period, and it decides the order of the rows. Use it to sort priorities and use Search Query Volume to judge demand, because the score ranks queries rather than counting searches.
Can SQP show a competitor’s brand share?
No. SQP shows the total for each query across all products, plus your own brand’s or ASIN’s counts and shares, so competitors appear only as part of the total.
What does this page not cover?
This page covers SQP as a Brand Analytics report and leaves four neighbouring topics to other pages:
- Harvesting search terms and adding negatives belong to the Amazon Search Term Report guide.
- Choosing and bidding on keywords sits with Amazon PPC keyword research and management.
- How advertising affects organic position is covered in how Amazon PPC affects organic rankings.
- Fixing the detail page itself belongs to the Amazon listing optimisation guide.
What is the next step?
Start with one completed month in Brand view. List your ten highest-volume queries, mark the first stage where your share drops on each, and set the matching Search Term Report figures beside them. That gives you a short list of queries where a specific fix, rather than a general bid change, is likely to pay back. The Amazon advertising reports hub shows how SQP fits with the other reports.
If your team has the data but not the hours to turn it into weekly actions across paid and organic search, Clear Ads Amazon PPC management turns search and campaign data into decisions about coverage, listings and bids.
Also read: How to monitor Amazon ads